In late May, I returned from visiting family in Barcelona. To get myself back into the grind at work, I dutifully looked at my weather app, which showed a chance of rain for 8 of the next 10 days. I can’t recall seeing such a wet forecast for southwestern Minnesota. Given that yours truly is full of deep thoughts, this popped into my head: “Hmm, rain makes grain.”
The end of May and start of June have been a difficult time for grain markets. Cue another deep thought on the seller’s lament in a down market: “I should have sold more.”
Sometimes it is difficult to put a positive spin on a down market, but I’m always willing to give it a try. I analyzed similar years with a specific thought on my mind. With a price break so sharp, a decent chance of a price bounce must lie in the months ahead. We need a second chance at pricing new-crop corn and soybeans in the months of July and August.
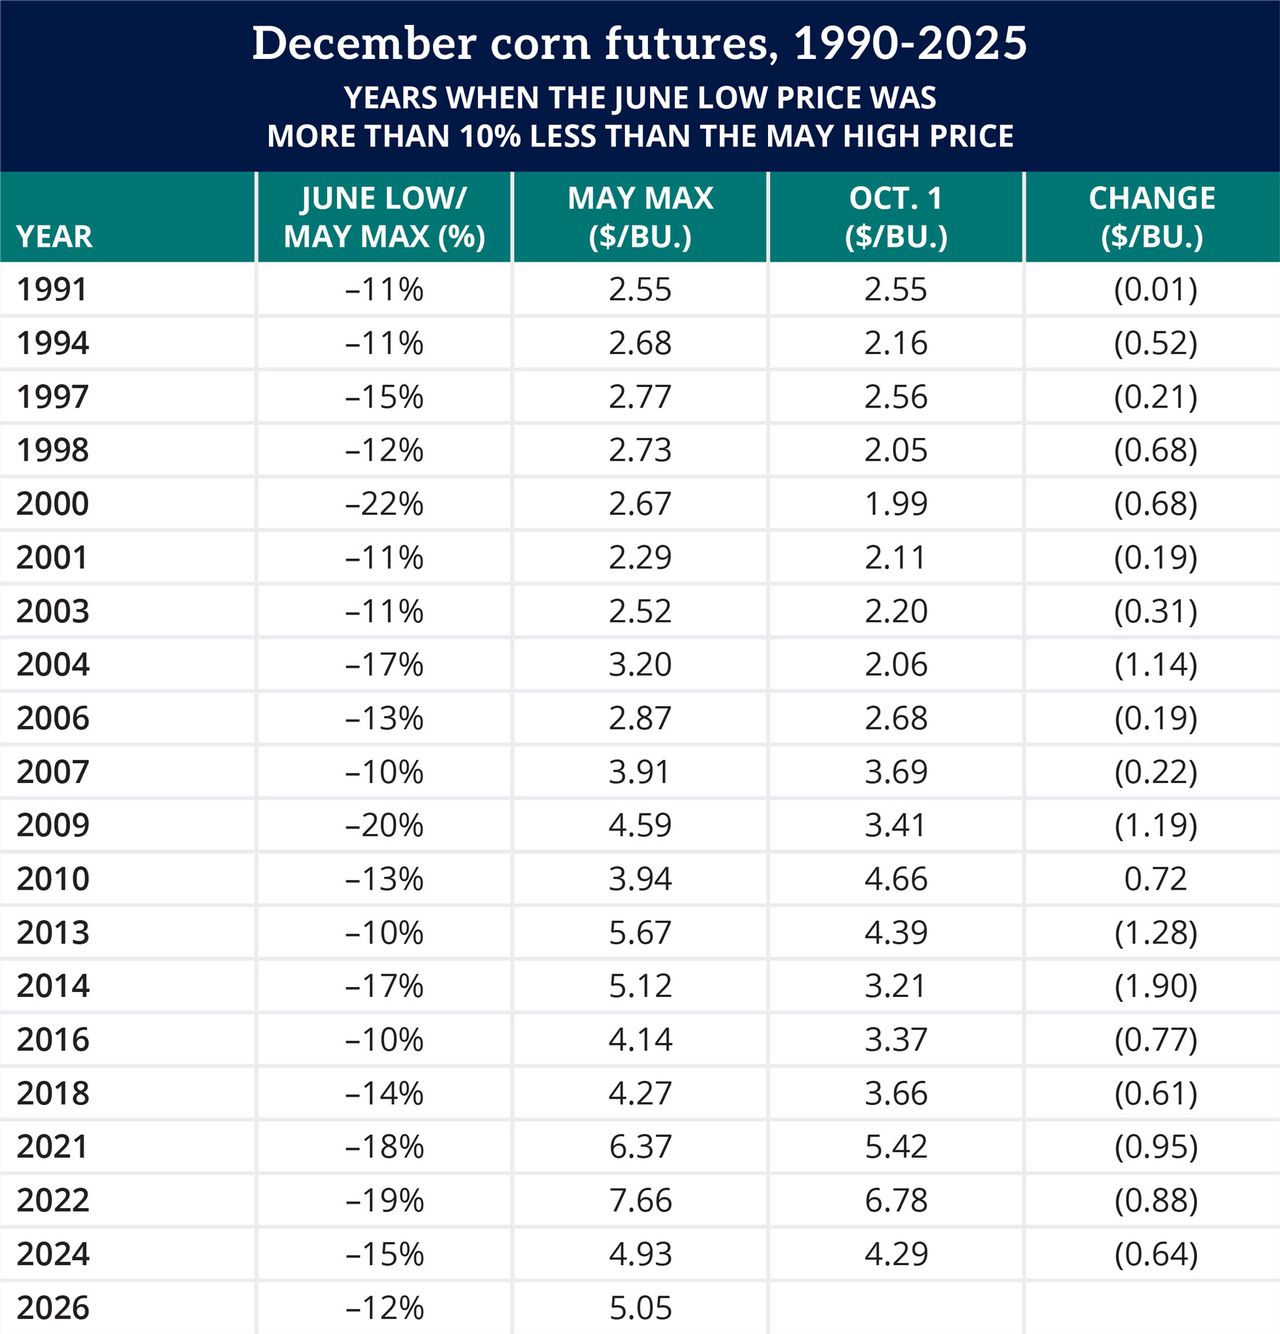
Through the first nine days of June, the June low closing price for December ’26 corn was $4.46 per bushel. That’s 12% less than the May high of $5.04 per bushel. A 12% decline from the May high is harsh, so I went back to 1990 in search of years where the December corn futures suffered a similar sharp decline from May highs to June lows. My first discovery was that May-June price breaks are not uncommon. In 19 of the 36 years since 1990 — more than half the years — the June low price in December futures was 10% to 22% less than the May highs.
Another deep thought: I need to find a positive spin. There must be a decent chance of a price bounce in July or August. I studied these 19 years, and here are my sad findings:
Of these 19 years with a sharp May-June price decline, the July maximum price met or exceeded the maximum price established in May in only three of those years. That’s less than 1 in 6 years. August was barely better — in only four years did the August maximum meet or exceed the May maximum.
December corn futures has a strong tendency to trade lower from spring to fall. Since 1990, the Oct. 1 price has been lower than the May 1 price in 3 out of 4 years (75%). How about these 19 years with a sharp May-June price decline? How does the Oct. 1 price compare to the May maximum price? The price in early October was lower than the May maximum in all but one year (2010).
My search for a positive spin did not work out so well. Looking forward, the higher prices seen in May might prove elusive. If, like me, you are singing the seller’s lament in a down market, let’s hope for a price rally and a second chance to price new-crop grain.