Choppy grain markets at harvest aren’t exactly a news flash, but corn and soybeans had company this fall. Prices of many assets treaded water, and traders blamed the indecision on uncertainty over the U.S. election.
That excuse may or not end quickly on Nov. 5. Whatever the outcome, one thing isn't likely to change overnight: the U.S. budget deficit.
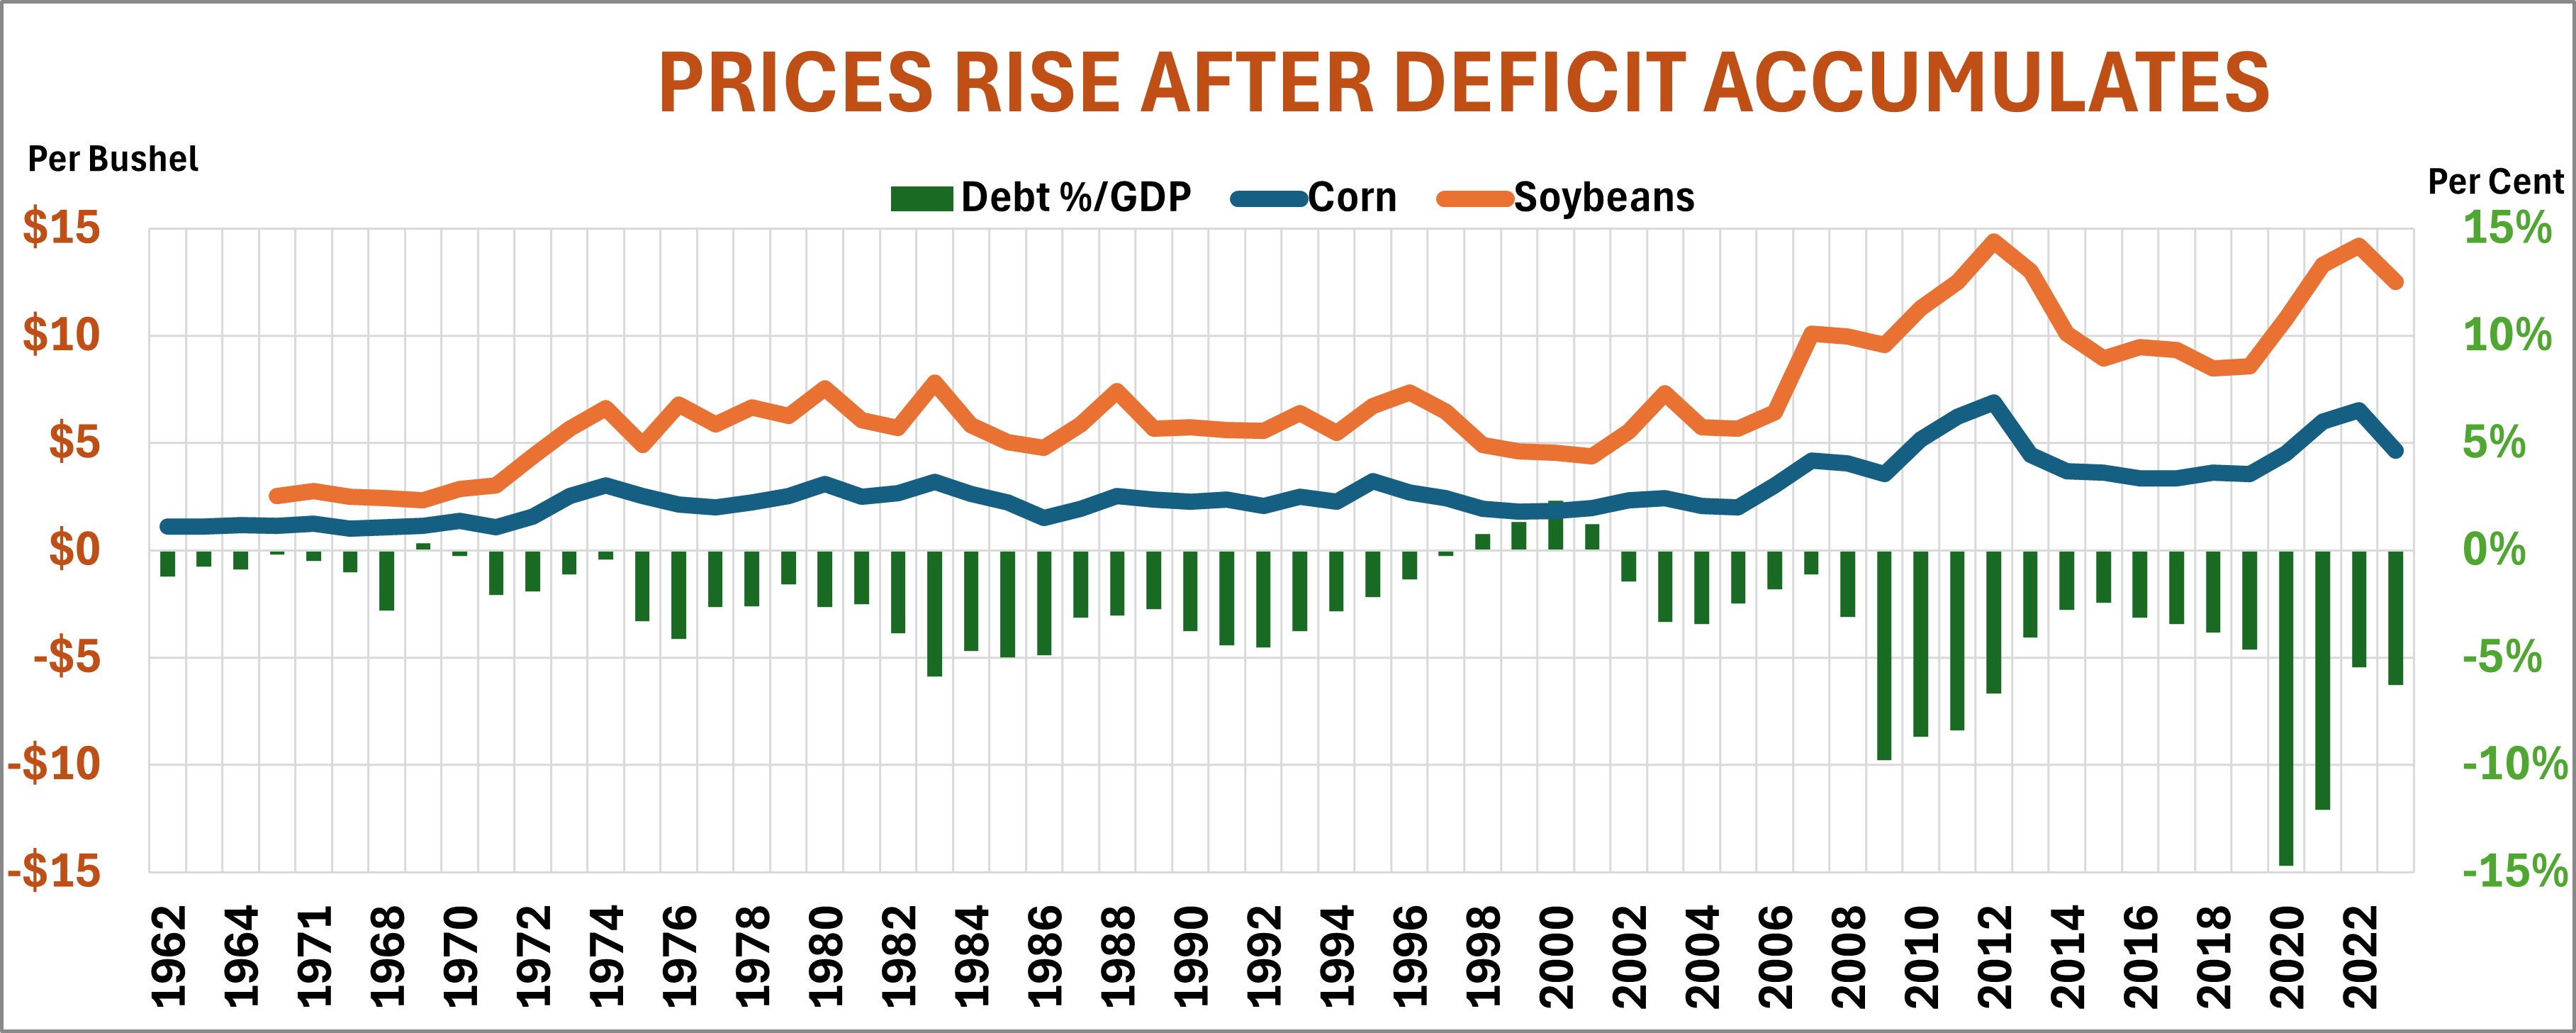
The government hasn’t run a surplus for more than two decades, and the red ink looks ready to keep flowing regardless of who wins at the ballot box. Politics and policy aside, that could be positive for growers. Crop prices tend to move just the opposite of the deficit. That is, higher prices followed bigger deficits, falling in the wake of better budget discipline in Washington.
Other markets, including stocks, currencies and Treasuries, also are correlated with budget deficits. With stocks the connection is negative, as it is with grain, while Treasuries and the dollar rise and fall in the same direction.
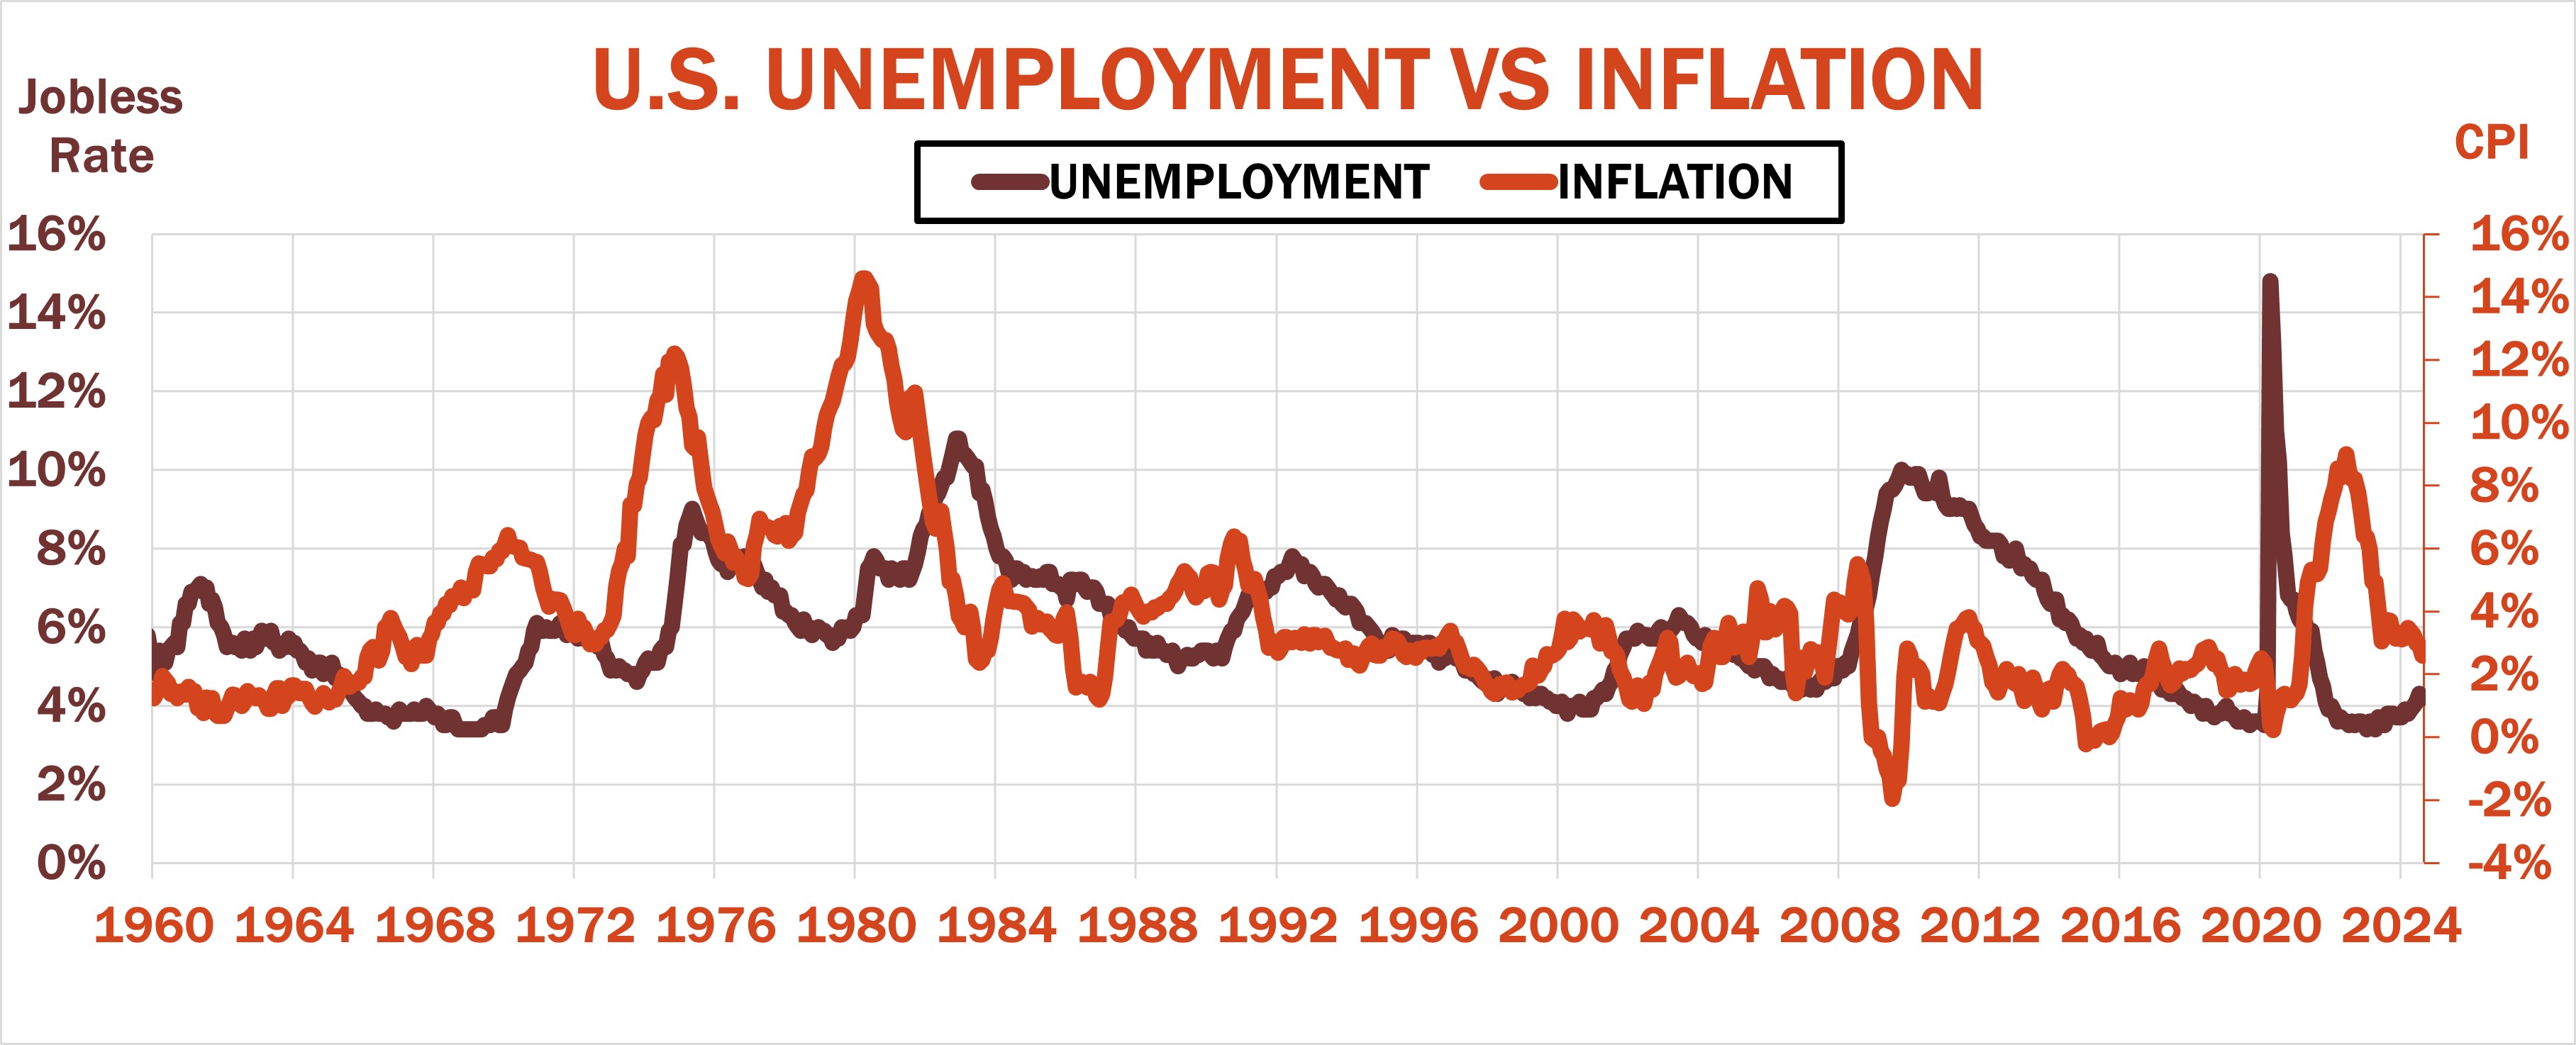
But corn and soybeans show the strongest correlation. Government spending on farm programs typically rises when farm markets falter. Bigger deficits also can fuel inflation, though this could be a chicken-or-egg question: Are deficits soaring because of inflation, or are deficits driving prices? As the textbooks say – and professors drum into students – correlation does not mean causation.
Like Mark Twain put it in his autobiography: “There are three kinds of lies: lies, damned lies, and statistics.”

Ag’s long tail
All of these correlations make sense. The stock market, like corn and soybeans, reflects seasonal patterns, but for different reasons. Yet even these may also have an agricultural legacy.
Crop prices tend to be weak at harvest, of course, because that’s when supplies are most available to the market.
Some of the biggest crashes on Wall Street likewise happened in these two months. Some authors trace the roots of these struggles back to ag because farmers’ need for cash to ship crops to market in the fall drained the banking system in the 19th and early 20th centuries – before the Federal Reserve System was created in 1913. Memories of those crashes may have remained in the psyche of investors, who also believe “sell in May and go away.”
Or this all could be a fluke connection, the result of chance. Roll the dice enough and snake eyes eventually show up. Transportation costs are important to farmers, but likely don’t cause many politicians any sleepless nights.
Help from the Fed
That’s why it’s impossible to know how any market will respond to the election. No matter: Analysts won’t stop prognosticating anyway. At least election betting markets were happy, attracting millions of dollars of volume to their casinos.
Last week, for example, trading on Monday was attributed to a plunge of more than $4 a barrel in crude oil, which gave back gains because Israel showed restraint in retaliations against Iran.
Crude recovered some of those losses thanks to tighter supplies – and more threats over Iran. Economics and fears about what might happen walked hand-in-hand.
So get ready for whiplash. And for markets, the election is only part of the story – albeit a very important one.
Indeed, as Americans go to the polls, officials at the Federal Reserve will get ready to cast their own ballots on monetary policy. The central bank’s two-day meeting won’t wrap up until Wednesday, Nov. 6, when another interest rate cut is widely expected. But unlike the Fed’s July announcement, which featured an unusual reduction of one-half of 1% to short-term benchmark Federal Funds. A one-quarter of 1% nip is all that’s expected this time.
That would adjust the Fed’s target to between 4.5% and 4.75%, with a similar cut expected at the last 2024 meeting Dec. 17-18. But those are mere appetizers to the full menu, with Fed Funds futures prices indicating a range of 3.50% to 3.75% by the end of 2025.

Ethanol needs grain
All this noise also rattles around just when ag traders must confront their own data demons: the Nov. 8 World Agricultural Supply And Demand Estimates and updates to the agency’s 10-year projections. While the 10-year outlook is the epitome of blue sky, it will still include acreage and price projections for 2025 – and sleep-deprived markets may or may not react.
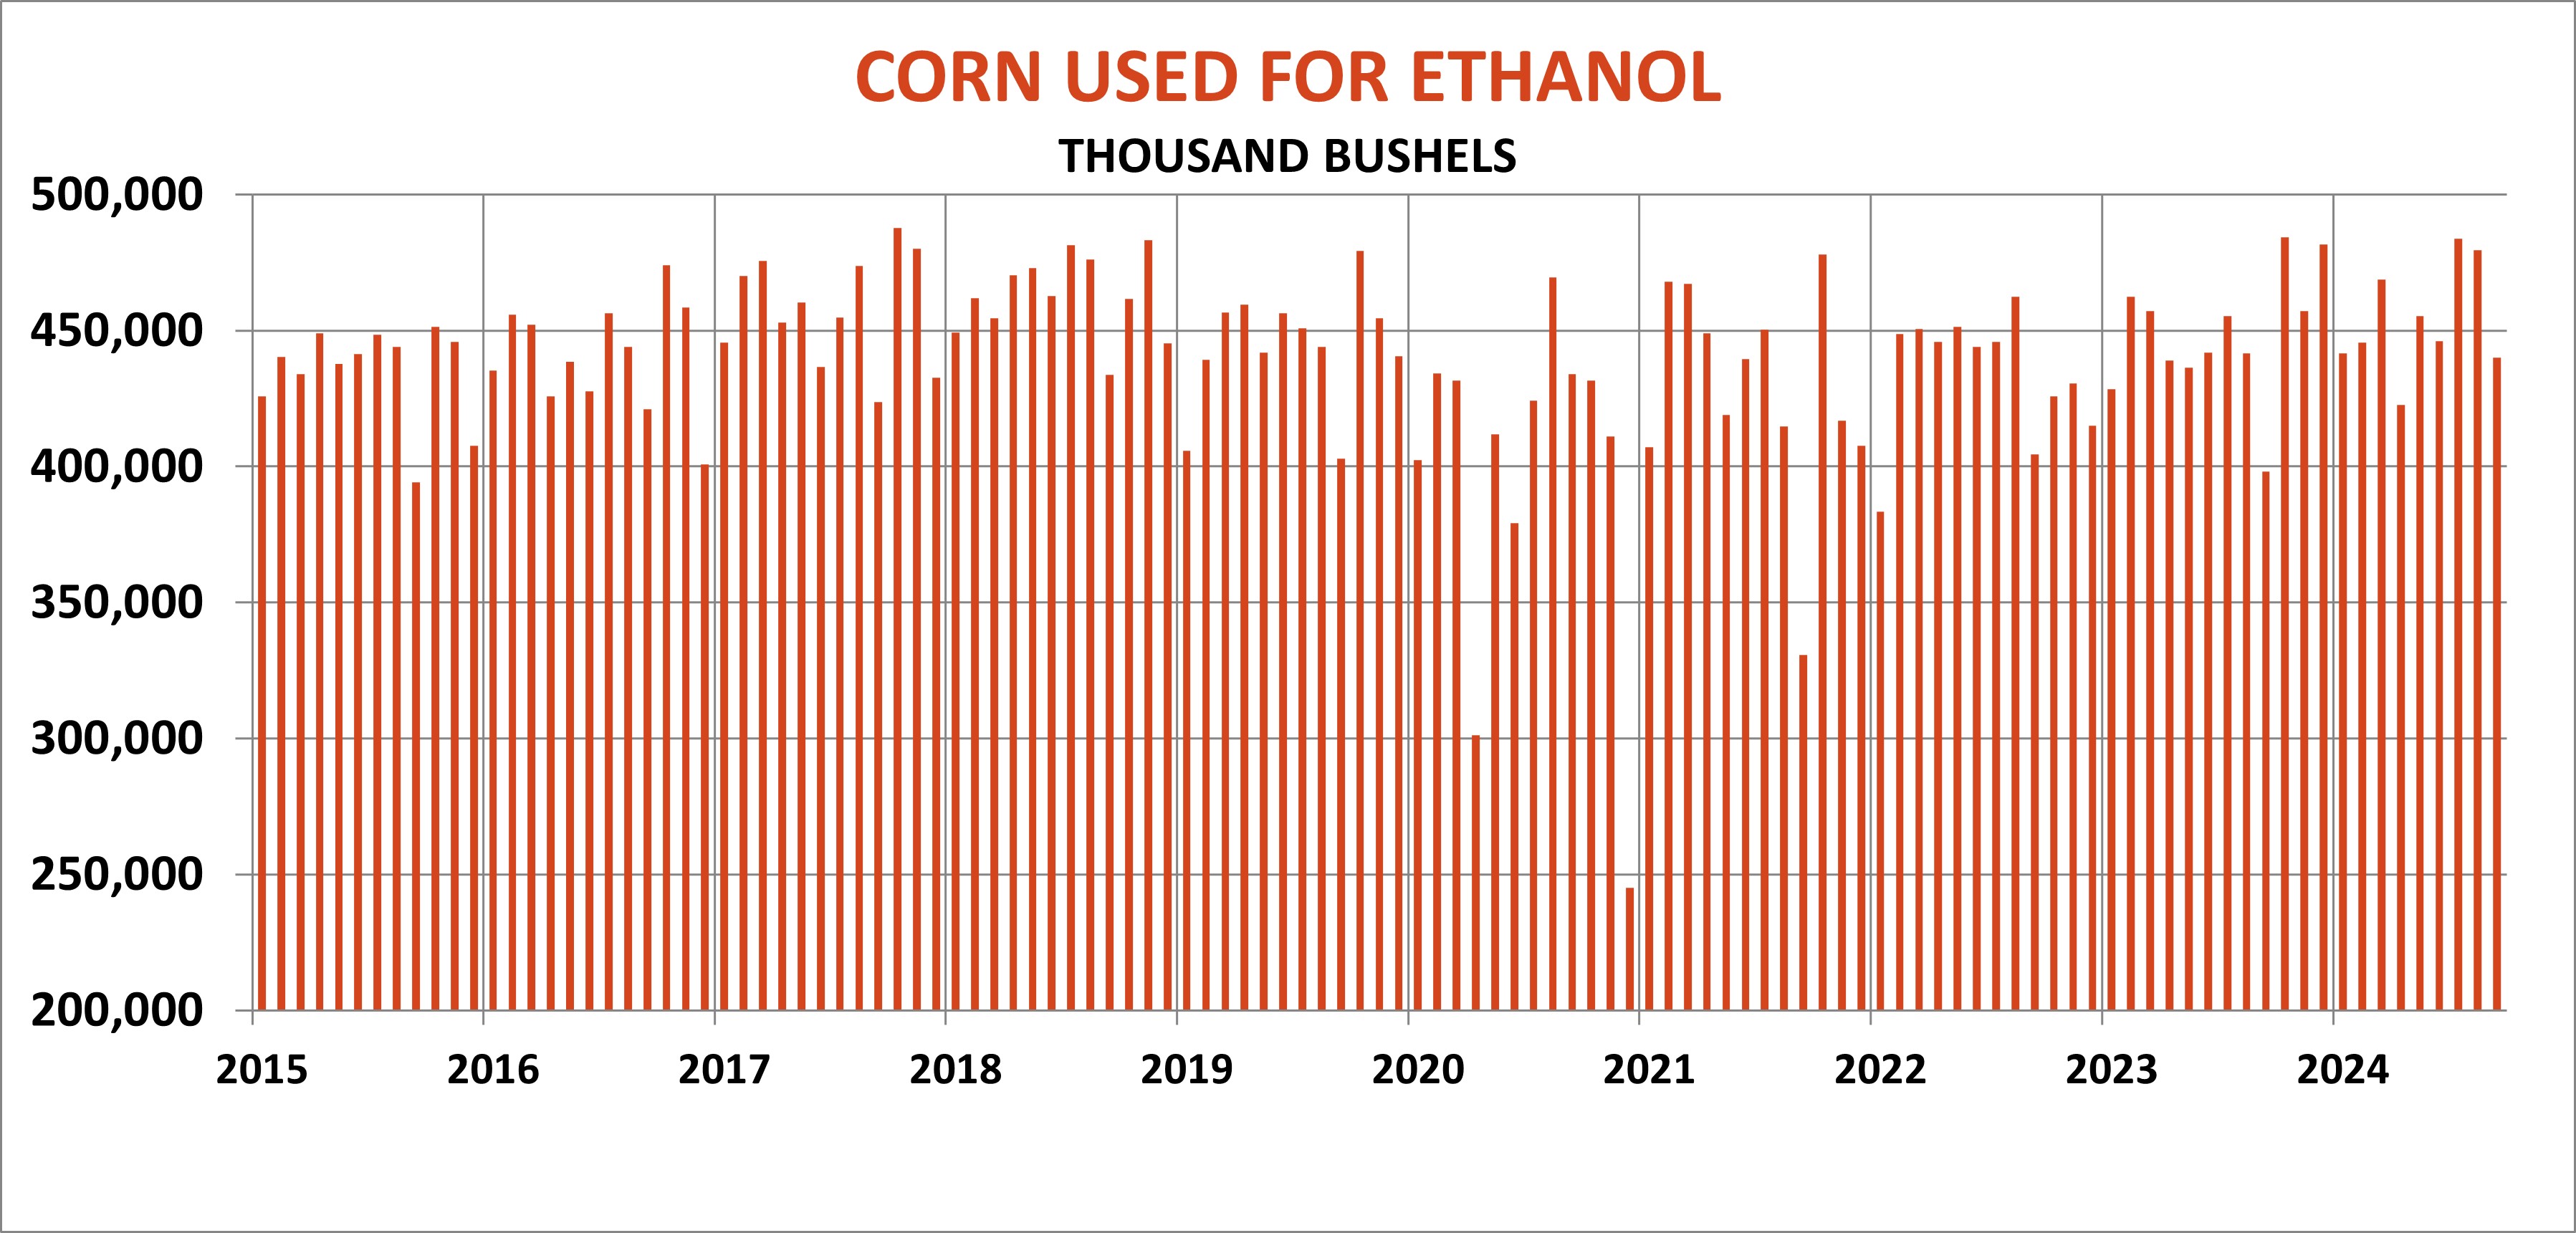
USDA set the table for the WASDE after the close Nov. 1 with release of new data on ethanol’s need for grain and soybean crush. These numbers are for September, the first month of the new marketing year, so discerning trends can be hazardous. For the record, ethanol plants ground 440 million bushels of corn in September 2024, 2.3% more than the previous year though off 8.2% from August. Soybean crush of 186.5 million bushels jumped 6.7% from 2023-24, beating my model’s forecast by 5.5 million bushels.
These suggest corn stocks at the end of the new crop marketing year Aug. 31, 2025, could be slightly higher than USDA’s previous estimate of 2.034 billion, with the top third of the futures range $4.03 to $4.34. March 2025 futures closed at $4.2925, so bullish news likely is needed to generate better selling opportunities.
Soybean ending stocks for the 2024 crop marketing year could be a little tighter than USDA’s last forecast of 480 million bushels. Whether that produces better prices depends on the market whistling by threats of Chinese tariffs. If the mood changes, futures could indeed have upside, with my model pointing to a top-third of the futures range of $10.34 to $11.12, an improvement over Friday’s close of $10.0825.
