The grain market and Mississippi River are joined at the hip. Some 60% of U.S. corn and soybean exports flow to the world through the waterway.
Barges and the board share another trait: Neither changes course quickly. Captains start slowing tugs long before beginning turns. Likewise, traders need plenty of distance to shift their focus from one marketing year to the next.
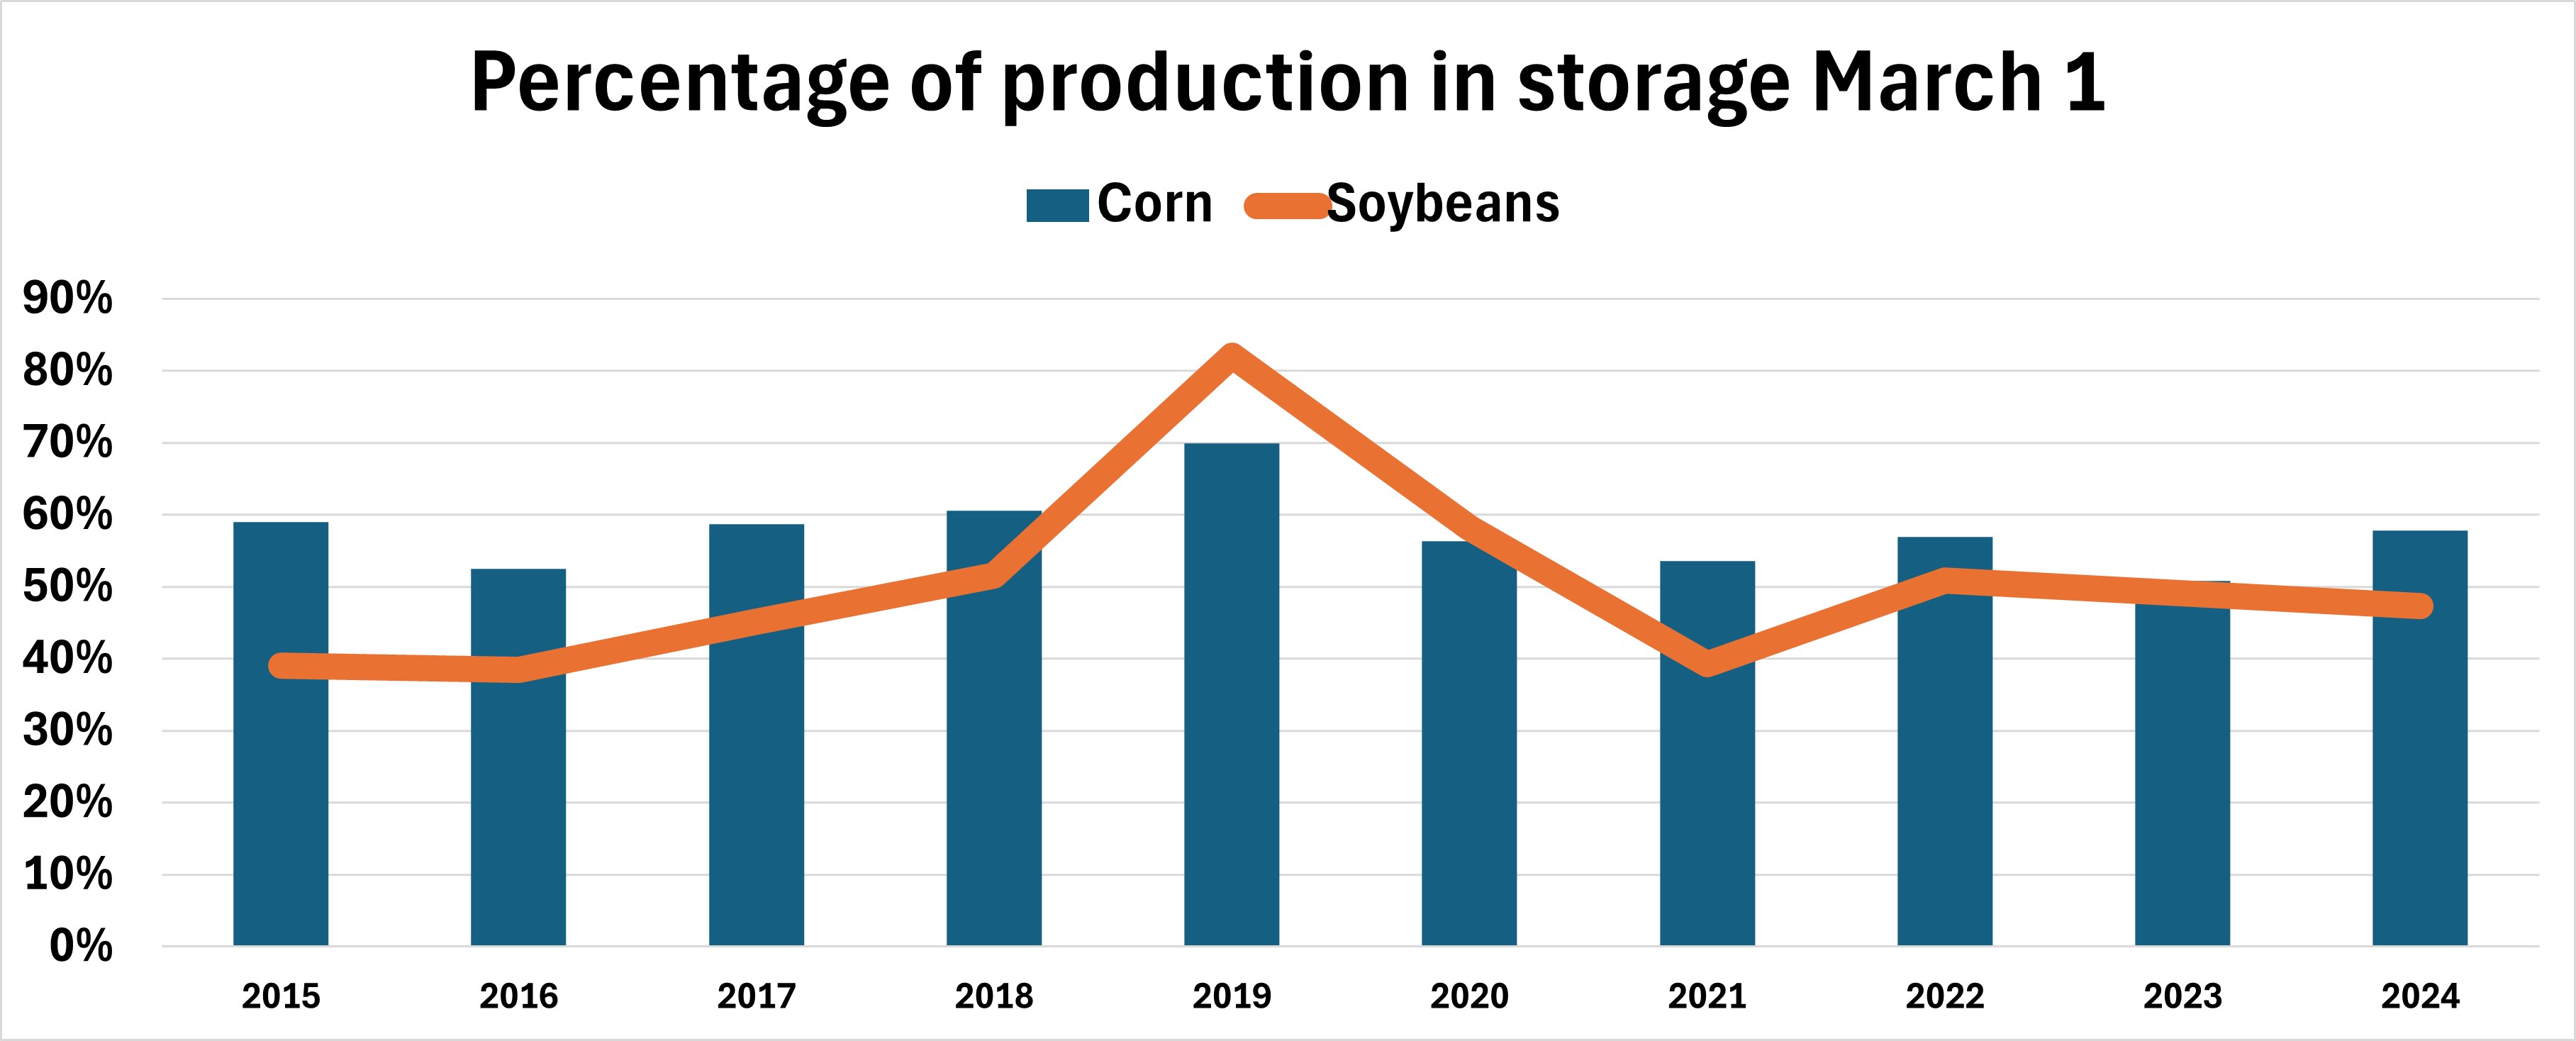
The annual migration from old crop to new starts this week, even though farmers likely have around half their 2024 production in storage and the 2025 marketing year doesn’t begin until Sept. 1.
Still, interest in new crop rekindles each February, when USDA puts out estimates at its annual Outlook Forum Conference in Washington. While the complete Outlook update officially comes out Feb. 23, a sneak peek dropped Feb. 18 with release of the so-called “baseline” forecast.
The baseline last week didn’t change much, if at all, from the government’s first go-round with these numbers in November. The late fall estimates come out as part of the federal government’s budgeting process, which projects farm program spending over the next decade based on estimates of how acreage, and more importantly farm prices, will fare.
USDA begins monthly projections for new crop in May. Until then, these numbers are as close as it comes to “official.”
So how could USDA’s crystal ball affect your pocketbook?
Soybean to corn prices 2.6:1
The baseline assumes 2025 acreage of 92 million corn with 85 million soybeans – 5.8% more corn and 2.4% less beans than in 2024. Higher corn stocks would lower average cash price from $4.10 for old crop to $3.90 for new. Soybean prices would fall from $10.80 to $10.
USDA would be justified if it chose to tweak the baseline this week, especially for soybeans. The baseline drew upon the October 2024 WASDE report, which printed that $10.80 soybean price. But the latest monthly update dropped the 2024 price to $10.10. That conceivably could lead to fewer soybean acres, though the ratio of soybeans to corn prices remains around 2.6:1, which favors the oilseed.
Another metric also tilts toward the soybean side of the teeter-totter: Returns over variable costs. The latest baseline projects $279 per acre for corn, $6 less than the $285 for soybeans. Corn brings in more revenue, thanks to projected yields of 182 bushels per acre. But the feed grain costs 80% more to grow, even though those bills are seen falling 3% for spring, while soybean expenses are projected 1% lower.
Tidbits from the baseline report
Coming in at more than 100 pages long, the complete baseline covers everything from soup to nuts – literally! (Tree nut production is expected to decline, but prices rise over the decade. See page 40 of the report for more.)
Here are more projections:
- Feed drives corn growth. “Growth in domestic corn use of 4.9% during the projection period is driven almost entirely by the feed and residual category, spurred by expanding corn supplies and meat production growth to meet domestic and export demand for beef, pork, and poultry.
- U.S. soybean exports fall. “The U.S. share of global soybean trade is projected to decline while Brazil’s share is expected to increase. Global import demand growth, led by China, is mainly fulfilled by increased exports from Brazil.
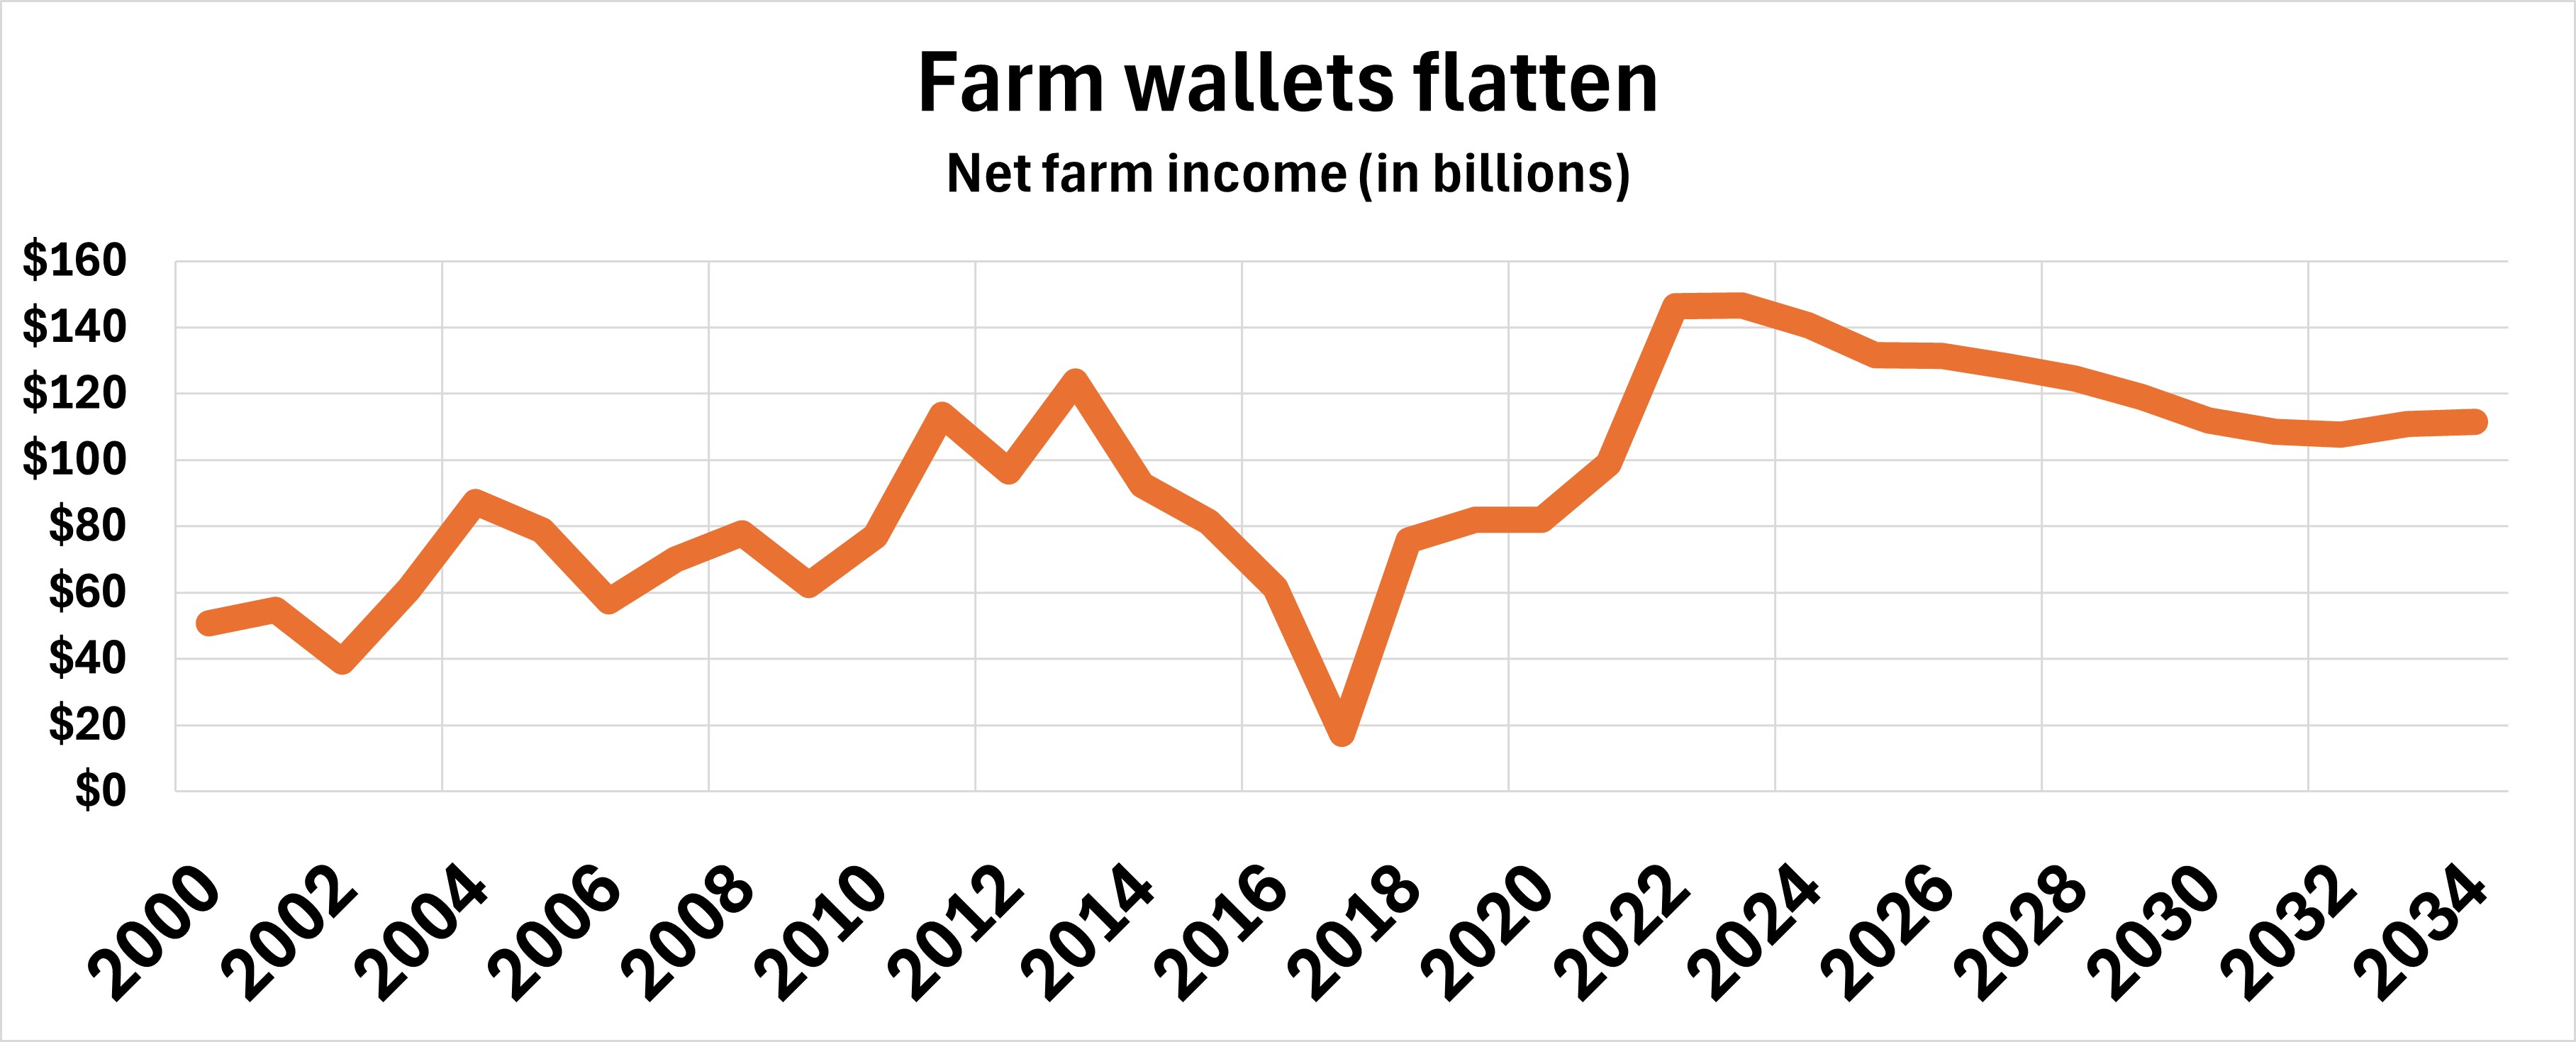
- Farm income in decade-long decline. “Net farm income and net cash income are forecast to decrease in 2025, following the declining trend seen in 2024. Net farm income is forecast to decrease $9.1 billion, or 6.5%, from $140.7 billion in 2024 to $131.6 billion in 2025. Net farm income is projected at $111.6 billion in 2034.”
- The dollar stays strong. “Over the 2025–34 projection period, the U.S. dollar is expected to weaken gradually in the initial years but remain strong compared to many other currencies, before beginning to strengthen and appreciate slightly against its agricultural trade partners.”
Never mind
The baseline makes interesting reading (for those so inclined). But is it realistic?
It’s a guess, for sure, and one based on information already out of date. Complicating such forecasts even more is the uncertainty of the times we live in.
- What will happen to biofuels policy?
- How about relations with China, the EU, Ukraine and Russia, and the rest of the world?
- Tax rates?
- The projections assume the present state of affairs, including the farm bill, continues into the future.
But is a Goldilocks approach realistic? A caveat in the baseline forecast is of note:
“The baseline projections assume no major shocks to supply or demand.”
No big-time droughts, wars, or financial collapses? Sounds pretty nice, and, unfortunately, unlikely.