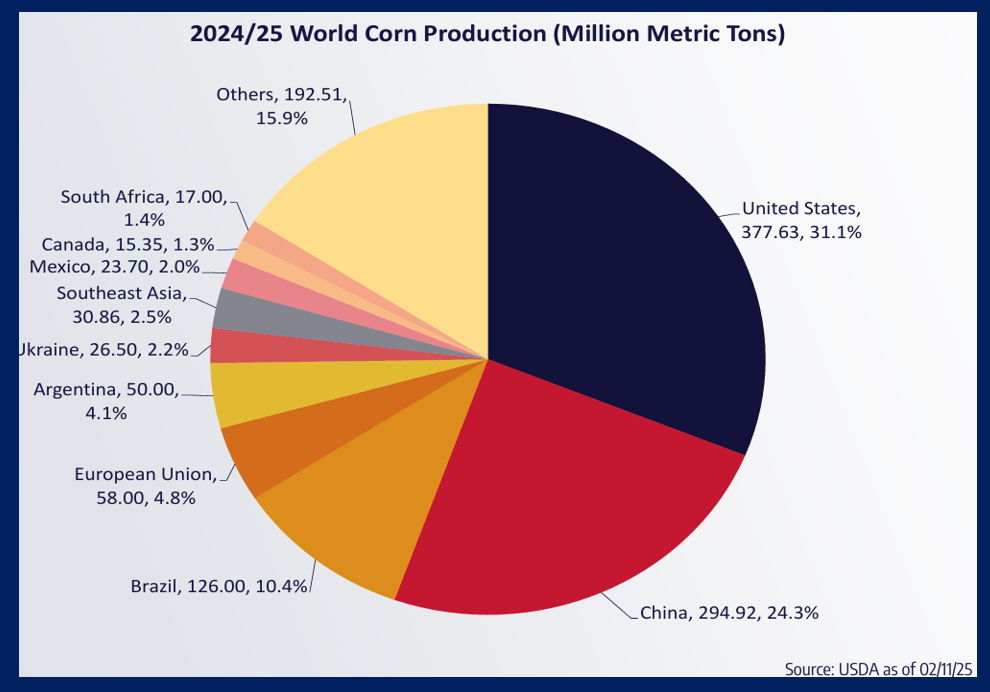
It is important to understand how much the United States matters when it comes to global corn production. As of the most recent USDA data, the U.S. leads the world in corn production, growing 31.1% of the world’s supplies.
China is the second largest corn producer with 24.3%, followed by Brazil with 10.4% and the European Union with 4.8%. Argentina contributes 4.1%, and Ukraine delivers 2.2%.
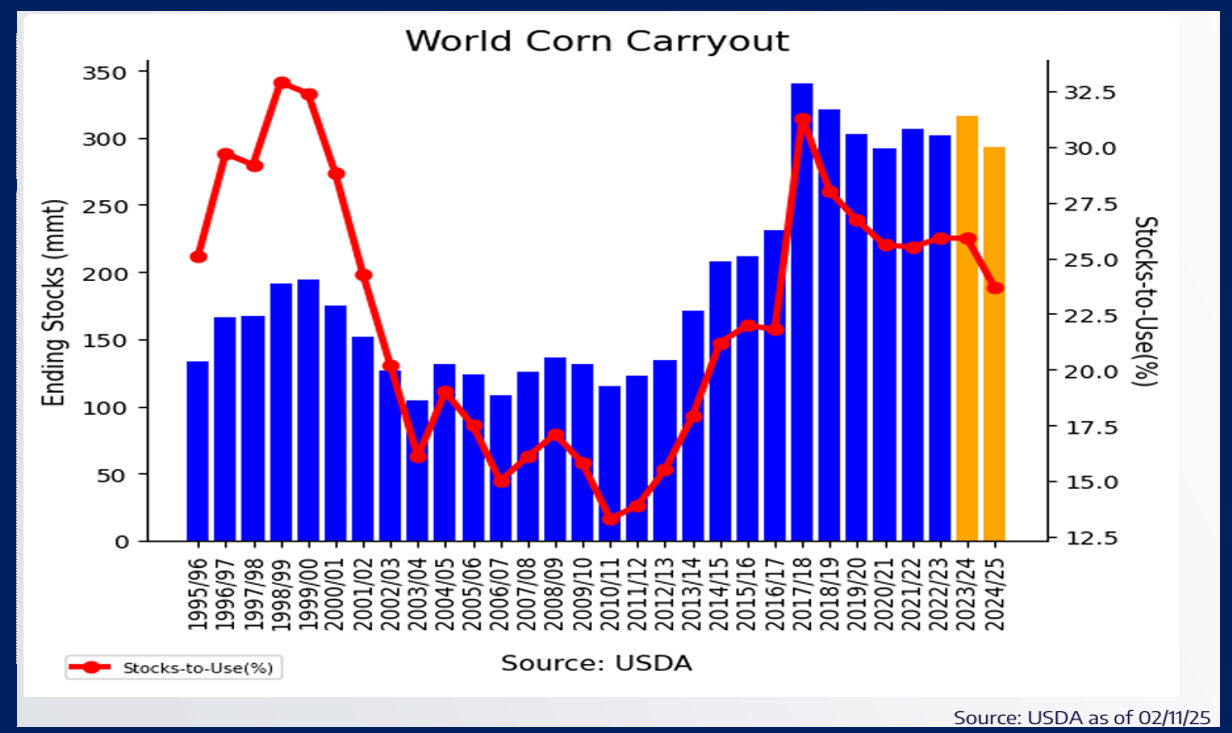
Global demand for corn remains robust. Global corn ending stocks and the stocks-to-use ratio is the smallest in eight years.
The world cannot afford any production issues for the safrinha, or second crop corn, currently being planted in Brazil, or for the Northern Hemisphere growing season this summer.
What’s happened
The recent corn market fundamentals with strong demand and now a smaller U.S. and global corn carryout got me thinking about how the past seven months felt similar to a different crop year.
After jogging my memory and looking at historical charts and USDA reports, indeed, the past seven months for corn supply and demand information and the $1 futures price rally that started in August is similar to how late 2020 into early 2021 played out.
If you remember, back in August 2020, the U.S. faced burdensome supplies of corn with corn carryout pegged at an astonishing 2.756 billion bushels! The price of corn reflected that – with corn futures prices trading near $3.25/bushel.
But then came along the infamous derecho storm which decimated the corn crop in Iowa. Soon thereafter China was quick to oblige to a large portion of the Phase One trade deal and purchased 845 million bushels of U.S. corn.
That large export purchase increased demand on USDA spreadsheets, which brought ending stocks down. Then in January 2021, on the USDA WASDE report, the USDA did a surprisingly large drop in U.S. corn yield, which further slashed ending stocks to 1.552 billion bushels.
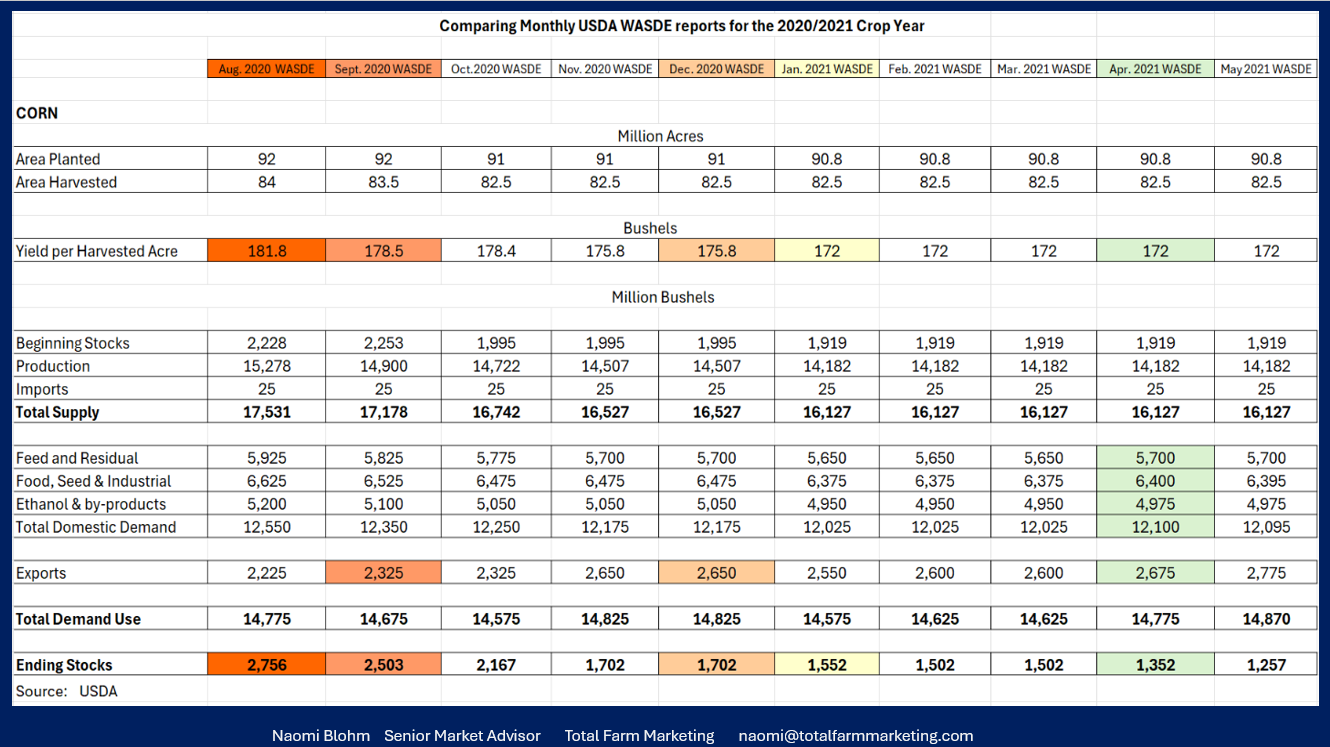
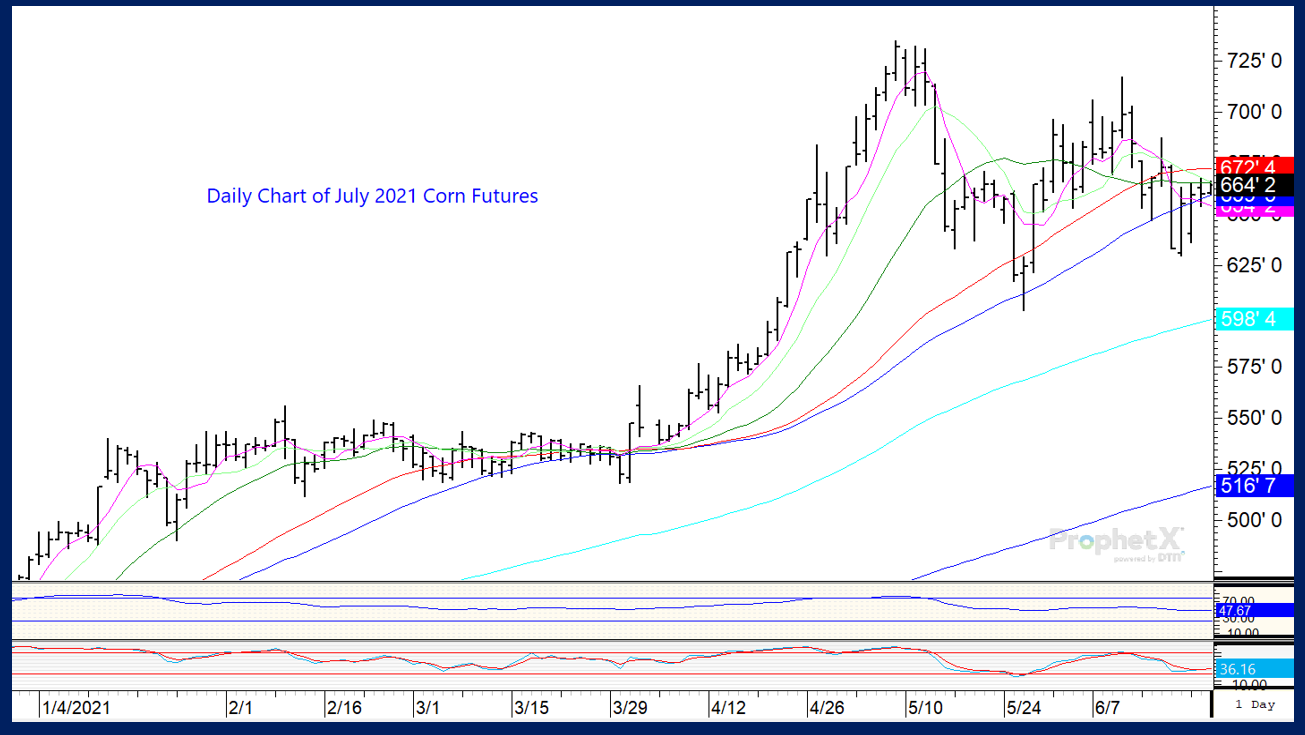
In late March 2021, the Quarterly Stocks report confirmed additional demand increases for corn, which continued to bring ending stocks down further. From late March 2021 into the first week of May 2021, July corn futures rallied over $2!
From a marketing perspective
Is this jogging your memory and feeling familiar to you, too?
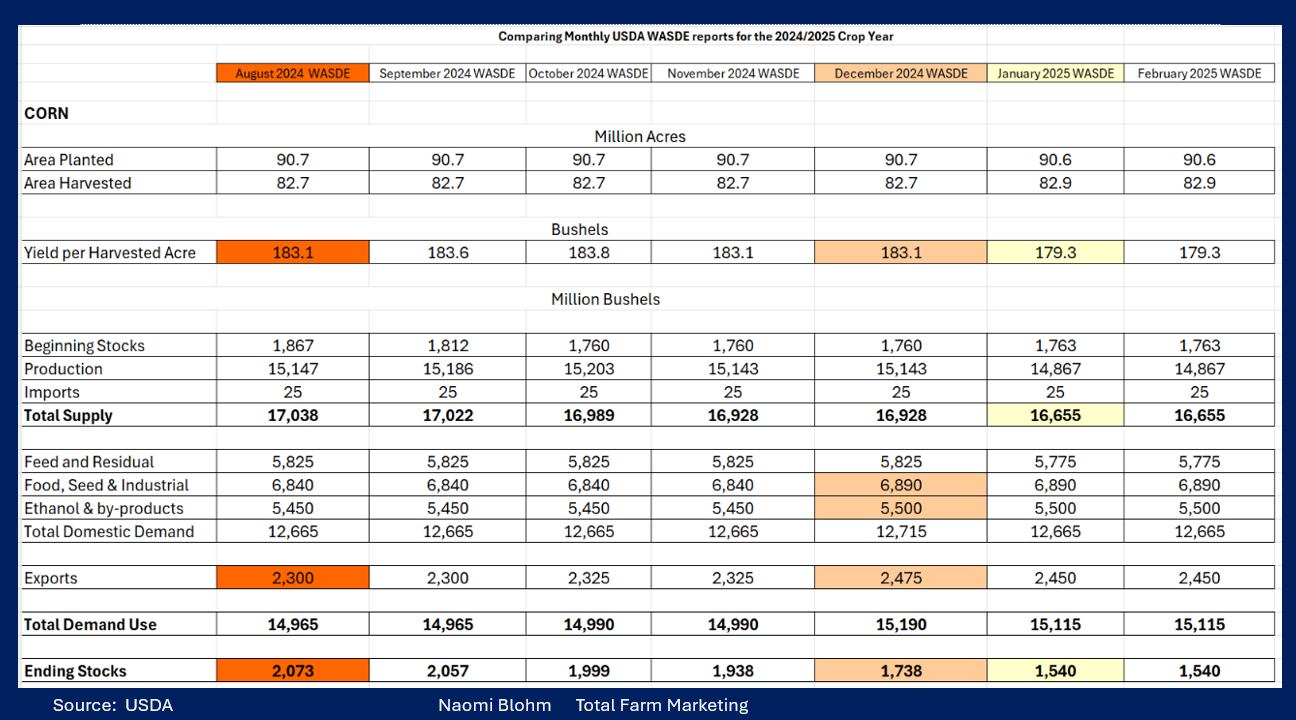
Corn futures prices rallied nearly $1 since September – thanks to strong demand and lower than expected U.S. production. Back in August 2024, U.S. corn ending stocks were pegged at a whopping 2.073 billion bushels.
High perceived carryout last August and harvest pressure weighed on corn prices, which left corn prices near the $4 price point back in early autumn. End users stepped up quickly and bought on value, pushing export sales and ethanol demand higher.
Fast forward five months, and now U.S. corn carryout for 2024-25 is at a much tighter number of 1.54 billion bushels, while global corn carryout is pegged at 290.31 mmt (down from 315.81 in the 2023-24 crop year).
A comparison of the USDA WASDE reports from August 2024 until now and information from the 2020-21 crop year shows many similarities between growing export demand and a lower yielding crop.
Looking ahead to the upcoming USDA WASDE reports, many in the industry feel that both export demand and ethanol demand for the 2024-25 crop year need to be increased, which would then likely lower ending stock values again, potentially allowing old crop corn futures prices to rally.
Last week's weekly export sales report showed that for the week ending Feb. 13, net corn sales came in at 1,453,810 tonnes for the current marketing year. Cumulative export sales have reached 76.9% of the USDA forecast for the 2024-25 marketing year versus a 5 year average of 68.6%.
Weekly ethanol production continues to be strong. In the 2024-25 marketing year to date, ethanol has used 2.667 billion bushels of corn with annual demand slated to be 5.5 billion bushels. If this recent pace of corn used for ethanol continues for the next 27 weeks of the marketing year, corn usage for ethanol is on pace to reach 5.626 billion bushels, (higher than the current USDA estimate).
If the ending stocks number for corn edges lower in upcoming USDA WASDE reports, that will be a fundamental reason for old crop corn futures prices to potentially rally into the early summer month time frame.
Prepare yourself
In the upcoming USDA reports it is important to monitor global ending stocks from both a domestic and global standpoint. Demand is strong.
If there is a weather issue in Brazil for the safrinha crop, the market may start to trade that news during the months of mid- to late March or April.
Regarding your marketing strategy, if you are choosing to sell corn in your bin sooner than later, perhaps consider a corn re-ownership strategy, just in case there is a weather flare up in Brazil in a few months or a friendly USDA WASDE report.
But also keep in mind that the geo-political situations of the world are keeping traders on edge, and one trade war flare up could affect the market in a negative fashion.
Also, holding out hope for a poor second corn crop in Brazil or a summer drought in the United States is not a great way to market your corn in your bin. What if the world ends up having “good enough” yields and sufficient production to meet that demand?
Be ready for anything.
Reach Naomi Blohm at 800-334-9779, on X: @naomiblohm, and at naomi@totalfarmmarketing.com.
Disclaimer: The data contained herein is believed to be drawn from reliable sources but cannot be guaranteed. Individuals acting on this information are responsible for their own actions. Commodity trading may not be suitable for all recipients of this report. Futures and options trading involve significant risk of loss and may not be suitable for everyone. Therefore, carefully consider whether such trading is suitable for you in light of your financial condition. Examples of seasonal price moves or extreme market conditions are not meant to imply that such moves or conditions are common occurrences or likely to occur. Futures prices have already factored in the seasonal aspects of supply and demand. No representation is being made that scenario planning, strategy or discipline will guarantee success or profits. Any decisions you may make to buy, sell or hold a futures or options position on such research are entirely your own and not in any way deemed to be endorsed by or attributed to Total Farm Marketing. Total Farm Marketing and TFM refer to Stewart-Peterson Group Inc., Stewart-Peterson Inc., and SP Risk Services LLC. Stewart-Peterson Group Inc. is registered with the Commodity Futures Trading Commission (CFTC) as an introducing broker and is a member of National Futures Association. SP Risk Services, LLC is an insurance agency and an equal opportunity provider. Stewart-Peterson Inc. is a publishing company. A customer may have relationships with all three companies. SP Risk Services LLC and Stewart-Peterson Inc. are wholly owned by Stewart-Peterson Group Inc. unless otherwise noted, services referenced are services of Stewart-Peterson Group Inc. Presented for solicitation.