USDA’s big reports at the end of March are known for producing double-digit price moves in ag markets. But gains or losses in corn after Prospective Plantings and Grain Stocks provide more reliable clues about the direction of prices over the rest of the growing season than changes in soybeans.
A higher corn close the day after the data drops means rallies during the spring and summer are likely to be stronger, with losses from the reports dampening rallies or even generating lower prices.
By contrast, soybeans can give more of a head fake, with gains from the reports triggering weaker bids or sometimes a long slog lower.
The market’s split personality makes sense. Most of the trade’s focus is on corn – how many acres farmers want to plant and how much old crop inventory growers is left halfway through the marketing year. Soybean seedings can vary with supply and demand fundamentals. But weather also comes into play if corn ground must be switched due to delays putting the crop in.
Price relationships are significant
These trends hold true in both cash and futures though they’re far from perfect predictors. Measuring reactions can also be tricky because release dates and times vary. USDA drops the data online now at 11 a.m. CT, but that policy didn’t take hold until 2013. For 20 years reports came out at 7:30 a.m. CT. Before that, in the days of paper pamphlets mailed to users, reports were released at 2 p.m., after the market closed. Traders huddled around teletype machines, “ripping and reading” special wire feeds to get the data without waiting until the U.S. Post Office delivered it.
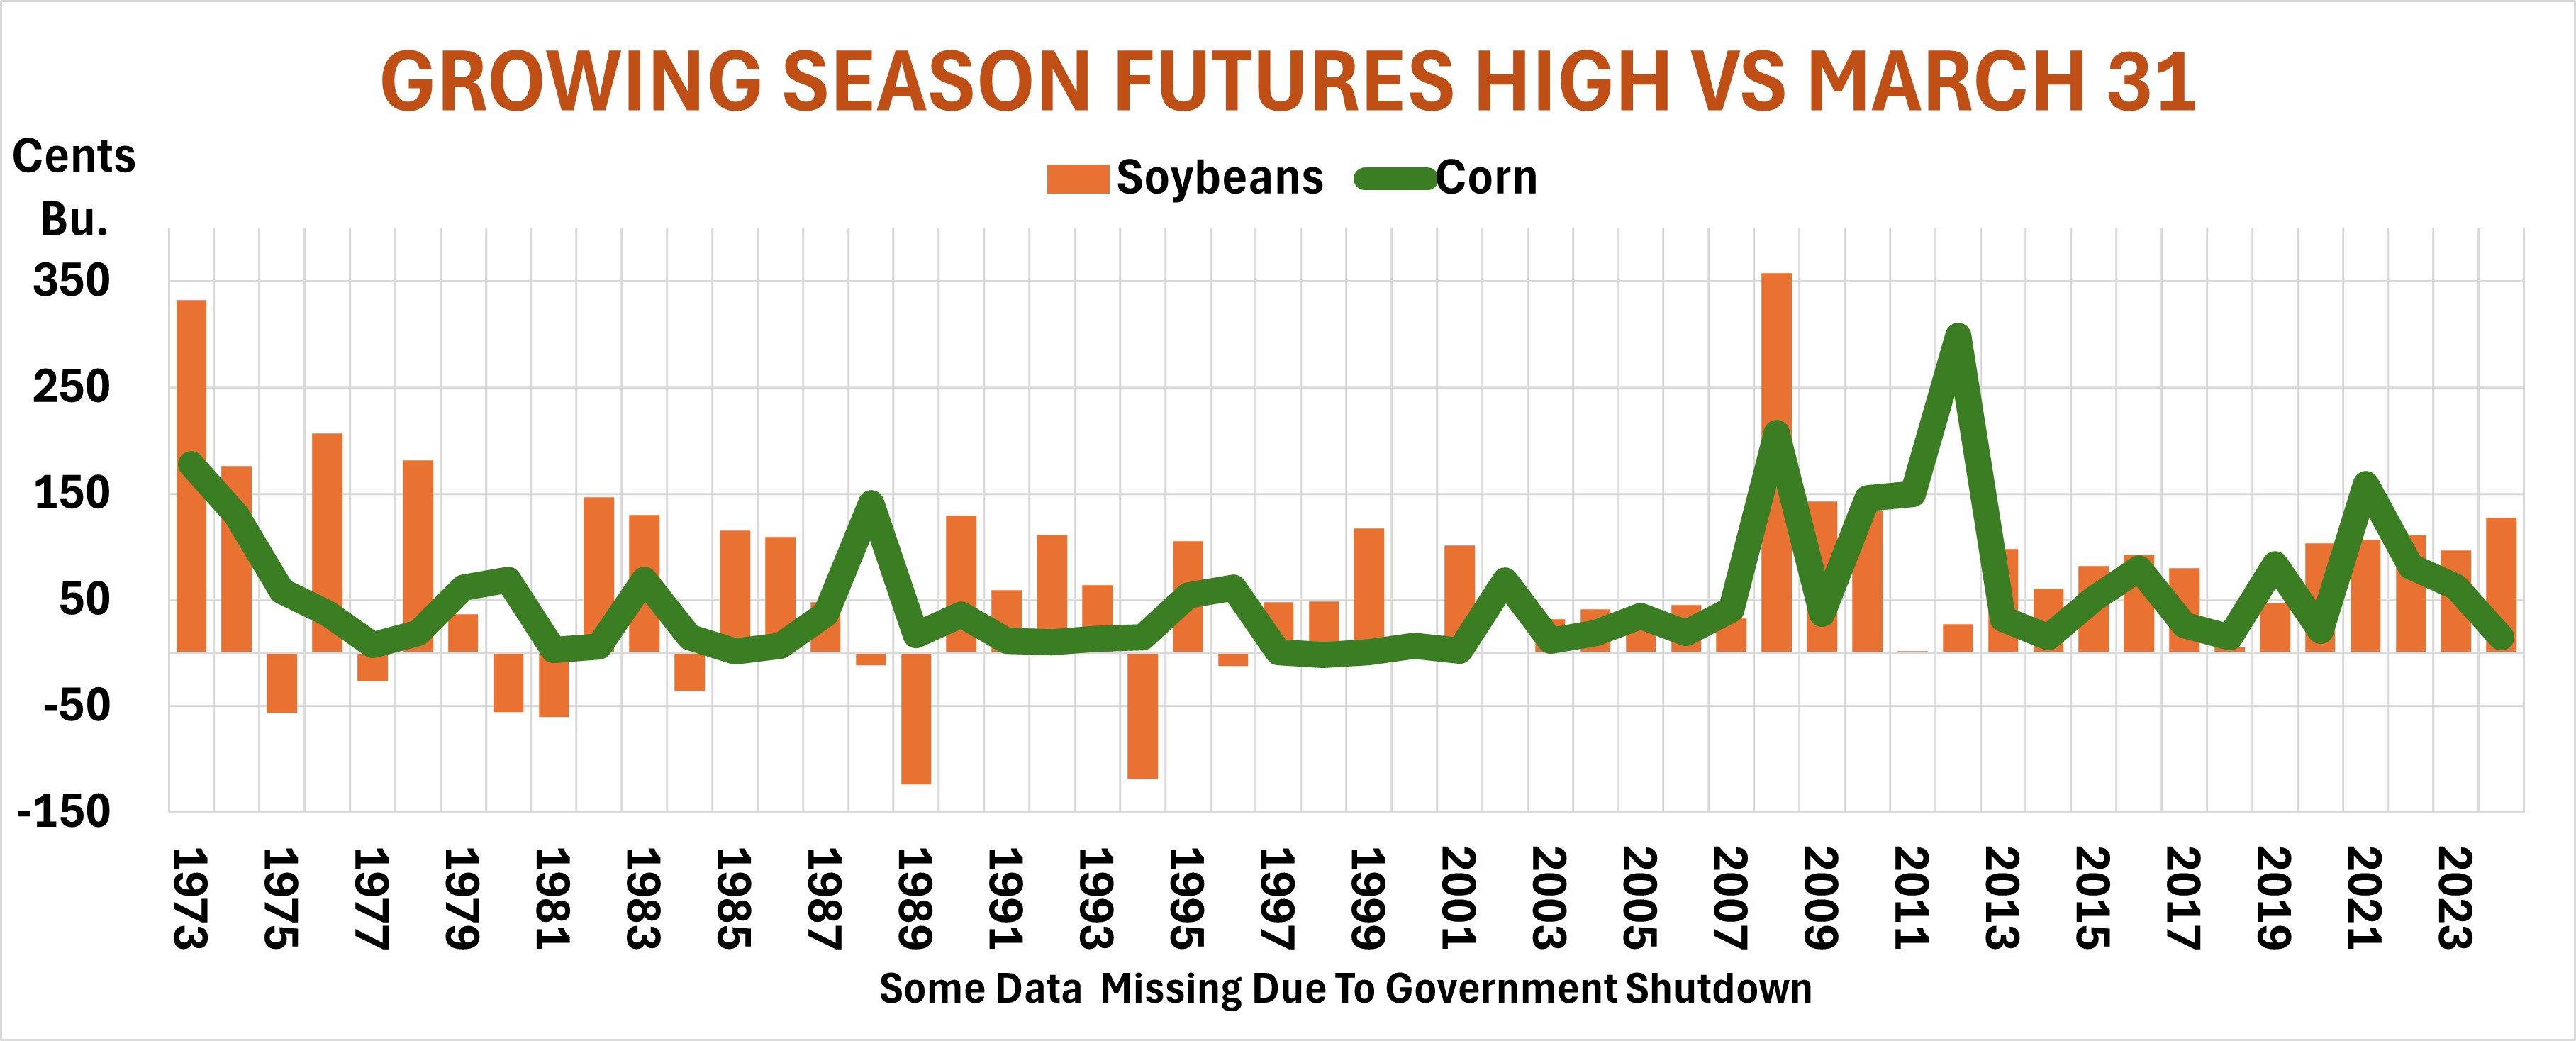
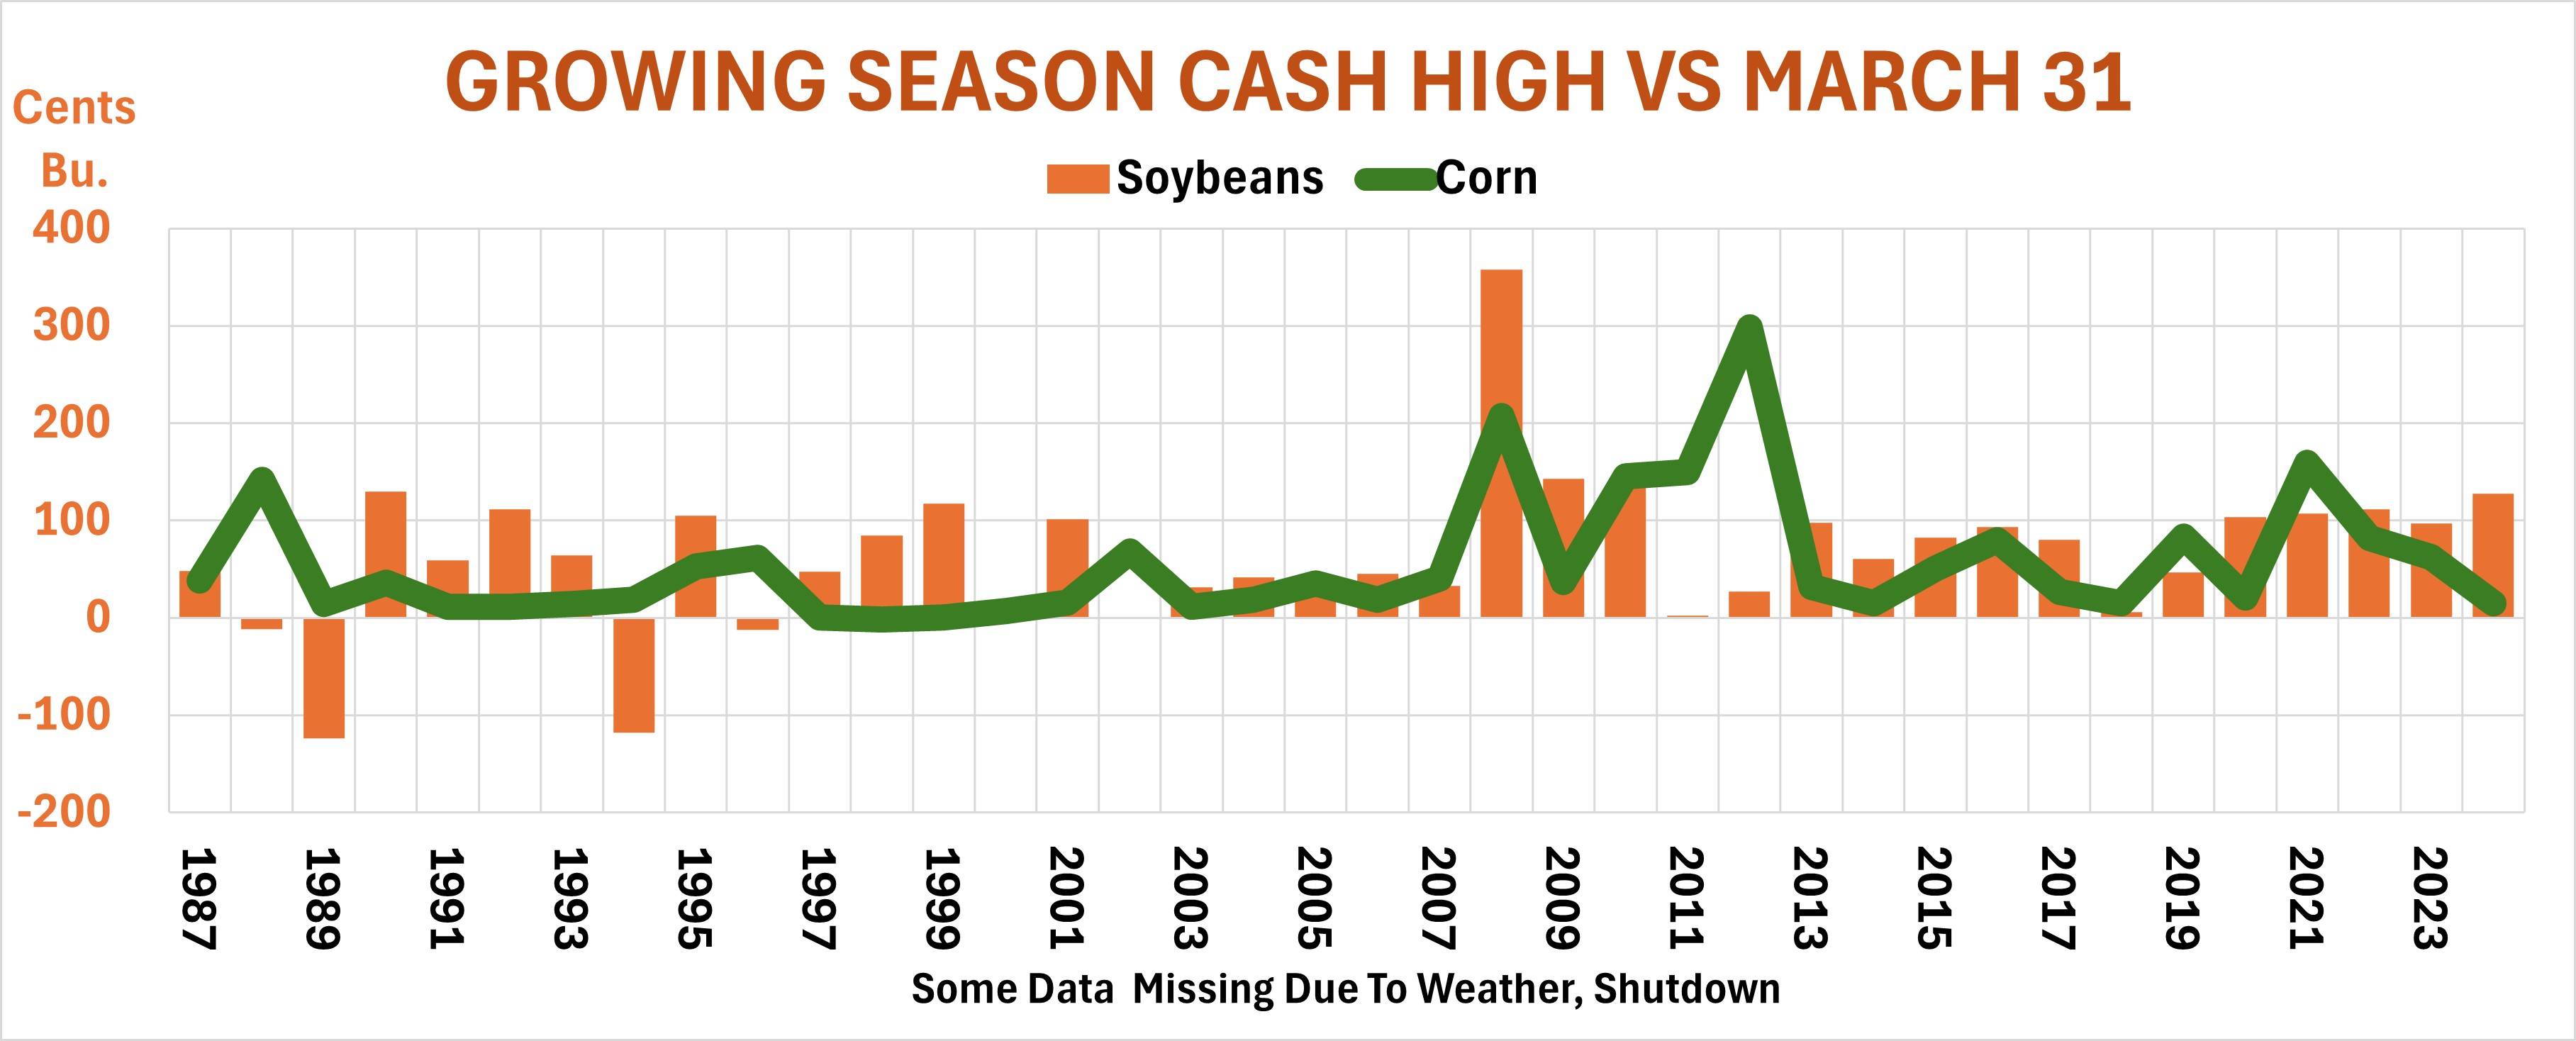
To analyze long-term trends, I relied on two sets of data.
- Price Reactions After Crop Reports, released by USDA on March 12. These use Southern Iowa cash bids, showing how old crop prices responded from 1987 to 1994.
- New crop futures data that I tracked from 1973 to 2024, for an even longer perspective—one that isn’t impacted by local basis considerations.
Price relationships in both cash and futures for corn were strong enough to be statistically significant. That is, they didn’t seem to stem from chance. This doesn’t mean report reactions actually caused longer term moves, just that they moved in a predicable manner.
Fine print aside, corn movements one day and one week after the reports point the way with a probability of 80% or better. So, if corn gains in the reports’ dust, chances top 80% the market also will be better, with a higher high later in the season. Or, if corn drops in the wake of the reports, futures could struggle the rest of the way.
Soybean patterns can be contrary
Patterns with soybeans are different. For one, they’re less reliable. Sometimes they turn out to be contrary indicators altogether. That suggests higher corn prices could bring weaker soybeans, and vice versa. In 1986. For example, corn dropped a penny on the board in the week after the March reports. But soybeans wound up with a rally of more than $1/bushel during the growing season.
As a result, higher corn prices after the report translate into the soybean market as little as 30% of the time. For bettors (or your March Madness pool), that means odds are 2-to-1 against the proposition. Or, at best, something of a longshot.
Numbers and statistics aside, this means putting more faith on moves in the corn market rather than soybeans. But whether you’re selling old crop or locking in new crop bids, remember that this early in the season, before planters and drills are moving, the market has a mind of its own. And it’s difficult to read!