Memorial Day means summer, and a fast start to planting has the new crop growing season well underway. But most growers still have plenty of old crop chores to complete as they contemplate prospects for the year ahead.
Halfway through the marketing year on March 1, the U.S. still held 8.5 billion bushels of corn and another 3.47 billion bushels of soybeans. The size, location and ultimate destination for those inventories should determine winners and losers as the selling season winds down.
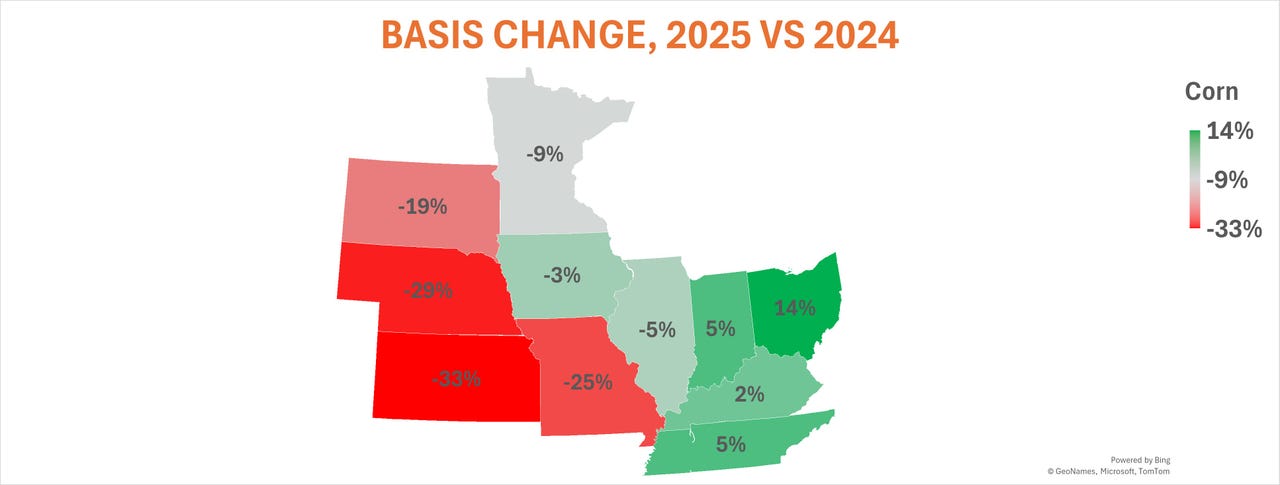
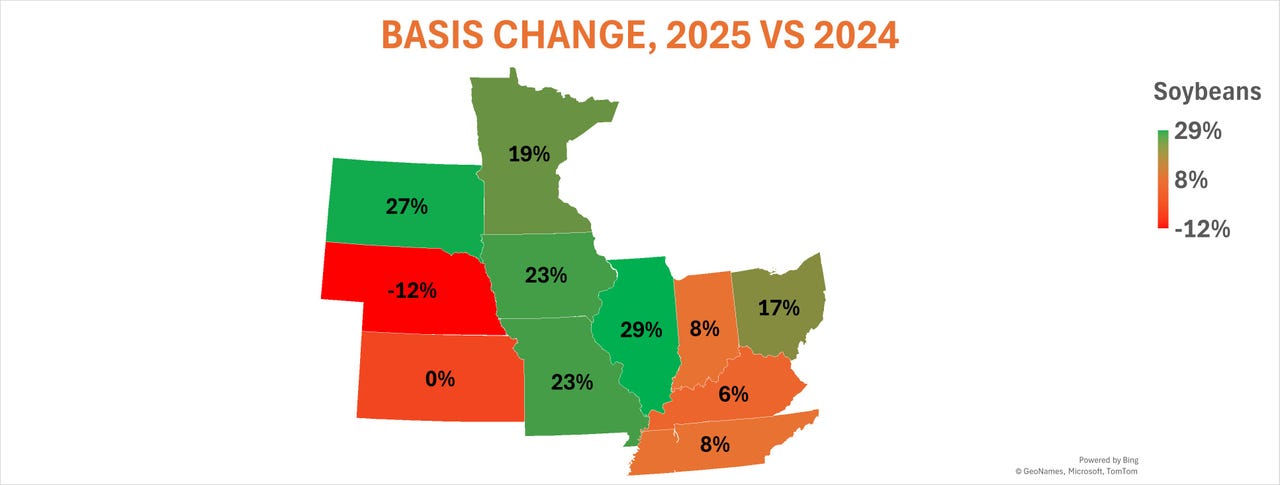
State-by-state breakouts illustrate how the market’s dynamics have already rearranged the map for 2024-2025 prices. Old crop corn bids strengthened in the eastern Midwest but eased out west. Soybeans showed their best strength along the Mississippi River pipeline, with mostly weaker basis on the east and west flanks of the Heartland compared to a year ago.
Supply and demand triggers
The maps above show fluctuations for old crop basis compared to last year, as measured by the difference between cash prices and July futures.
Not all locations publish forward prices yet for new crop, typically figured off December corn and November soybeans for harvest 2025 delivery. Those price points that do, don’t look all that much different. New crop soybean basis in Iowa, for example, strengthened compared to last year just like old crop did, while corn headed in the other direction.
Triggers for these changes came from fundamentals of supply and demand – what the market knows about stocks and usage, as well as the factors that figure into basis, looking both forward and backward.
- Trade areas for merchandisers tend to be more significant than state or county boundaries – a hog can’t taste the difference between corn from Illinois and grain from Indiana, whatever the squeals in the barn say.
- Transportation costs are important, impacting expenses for getting grain into position where it could be delivered against futures. Deliveries in the futures market are still mostly theoretical, but their potential acts as a reality check for futures traders who can get lost in speculative fever. This is also why your broker will be calling sometime in June if you have July 2025 contracts open—risking delivery is too big a hassle and can invite compliance issues too.
- Charges associated with the delivery process, regardless of whether it occurs, can add up quickly. In addition to load-out fees the bill can include fuel surcharges for rail shipments, and diesel for trucks and barges too.
- Money isn’t free either: Higher interest rates increase loan charges for debt incurred by storing grain and not converting it to cash through sales to end users.
All things considered, basis tends to strengthen when demand is stronger, forcing end users to pay a premium to obtain what they need.
- Corn buyers ease off the pedal as a result. Higher corn seedings this spring should boost supplies back to around a 42-day cushion if yields and usage come in as forecast, increasing the buffer by 25% year on year.
- Soybean supplies could be headed in the other direction, which convinced nervous buyers to jack up bids a little this spring. Lower soybean plantings should tighten the number of days’ supply by 16% if an average summer plays out.
Last-minute tweaks
With 100 days left in the 2024-25 marketing year that ends Aug. 31, old crop stock projections could still get some fine-tuning. Despite all the uncertainty over tariffs, not to mention war and peace, data out last week was in line with the pattern of existing fundamentals, including soybean crush from members of the National Oilseed Processors Associate, biofuels data released by the Energy Administration, and export sales and shipments from USDA.
Reports from the competition also did little to change the narrative. Traders are watching for any impacts from Argentine flooding, but dry soils there should allow the moisture to soak in.