Hold on to your sprayers! Kurtosis isn’t a new disease stalking fields this summer. But it could still threaten corn and soybeans.
Symptoms of kurtosis include fat tails. That may sound like a problem for middle-aged farmers, not their crops. But these are the tails, or ends, on either side of the familiar bell curve distribution of prices. The larger the kurtosis, the greater the uncertainty about the moves—up or down—in the market that could follow.
Prices were already volatile following imposition of punishing tariffs slapped on imports from China and other countries. Bombing of Iranian nuclear sites only ramped up the chaos for commodities even further. Would crude oil futures surge because Iran closed the key shipping lane in the Persian Gulf through the strait of Hormuz? Or would cautious cash-strapped consumers pull back and trigger a global recession, forcing crude prices sharply lower?
Analysts quick to say “I don’t know” applied the same logic to other markets ranging from stocks to soybeans, telling investors and speculators alike to buckle up. Suddenly, kurtosis was the buzzword of the day from Wall Street to Main Street.
This statistical term said both a lot—and quite little—about what could happen to the market.
Bushy tails
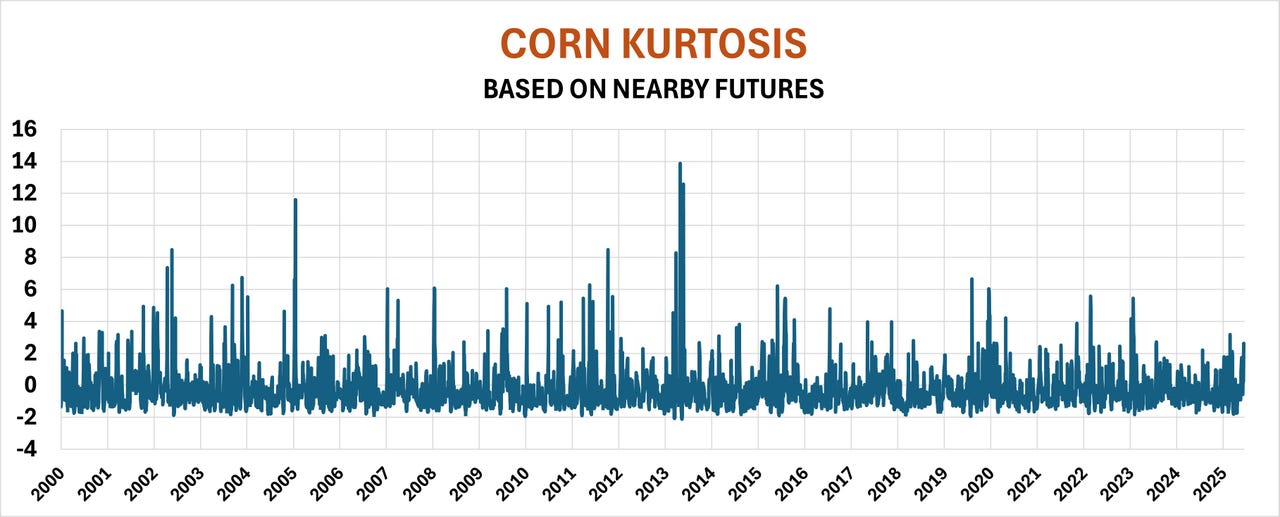
Kurtosis describes price curves, specifically their tails, or the end on either side of the bell. Price curves are formed by comparing a price to the number of times it closed at that level over a given period of time. Average prices are usually the most popular—that’s why they’re average—and are at the top, or apex, of the curve. More unusual prices are at the ends— really low prices and really high prices that are infrequent. Think $2 corn or $8 corn.
High kurtosis was a signal that price moves, either up or down, could be large and violent. Investors feared both $40 crude oil and $120 crude. Those worries in turn twisted other markets in knots.
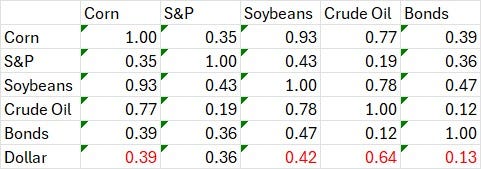
Jitters in corn and soybeans were especially understandable because those prices show a strong correlation with each other and with crude oil. Connection with other assets was lower but still enough to be statistically significant over the past 25 years.
Like most of the market’s demons, this one turned out benign, at least so far. But dodging a bullet isn’t the same as securing the weapon properly.
Easy as Pi
Kurtosis is relatively easy to calculate—Excel and other spreadsheet programs even have a function key for it. Results greater than 3 suggest potential for more extremes on either end of the distribution, inflating the average to be higher. Results lower than -3 tip just the opposite.
This serves as an early warning system for uncertainty but doesn’t provide specifics. That’s where a related statistical measure is needed: implied volatility, the market’s perception about what prices could do in the future. Multiplying the price, of say corn, by its implied volatility, and then again by the square root of the length of options’ life until expiration in years provides this guidance.
Last week, for example, an at-the-money December corn call had an implied volatility of 21.64% with 148 days until expiration, figures available from the CME’s QuikStrike tool and other services. So, with December corn at $4.22 and 0.405 years until expiration, the contract’s expected range plus or minus is 57.5 cents, or $3.64½ to $4.79½.
With USDA most recently estimating full economic production costs topping $4.90 a bushel cash, this showed making a profit on the crop might be difficult, with significant potential of losing more than $200 an acre.
Knowing this doesn’t make the situation any easier. But it at least provides guardrails, as well as motivation, for hedges to manage the risk proactively.