Futures markets often are compared to roller coasters. But the grain market this summer looked more like the kiddie ride at a neighborhood fair than a cyclone or twister.
But it’s time to grab onto your hold bars. Prices look ready to fall back to earth as July gives way to August. The question now is how low, not high, the market can go.
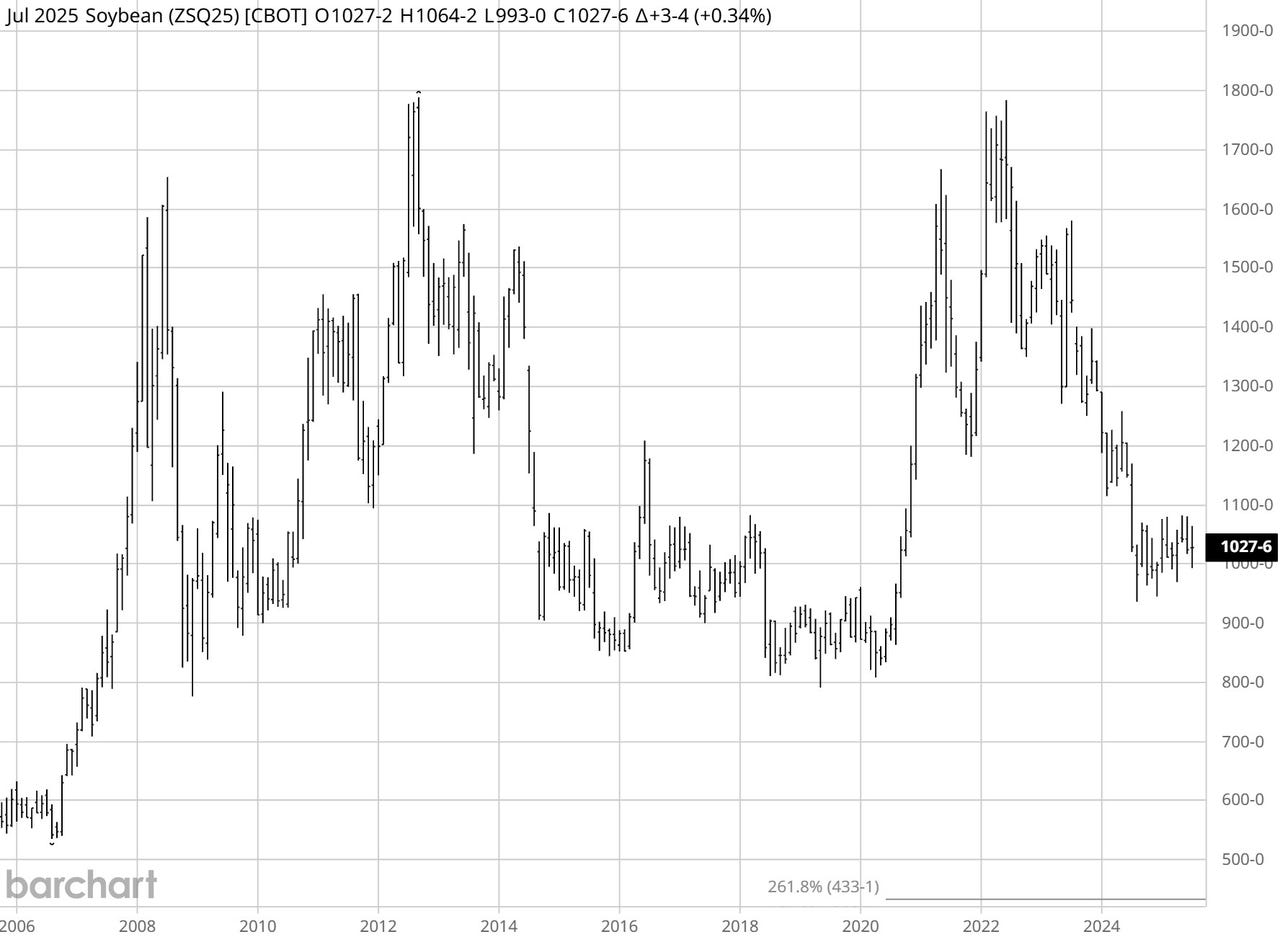
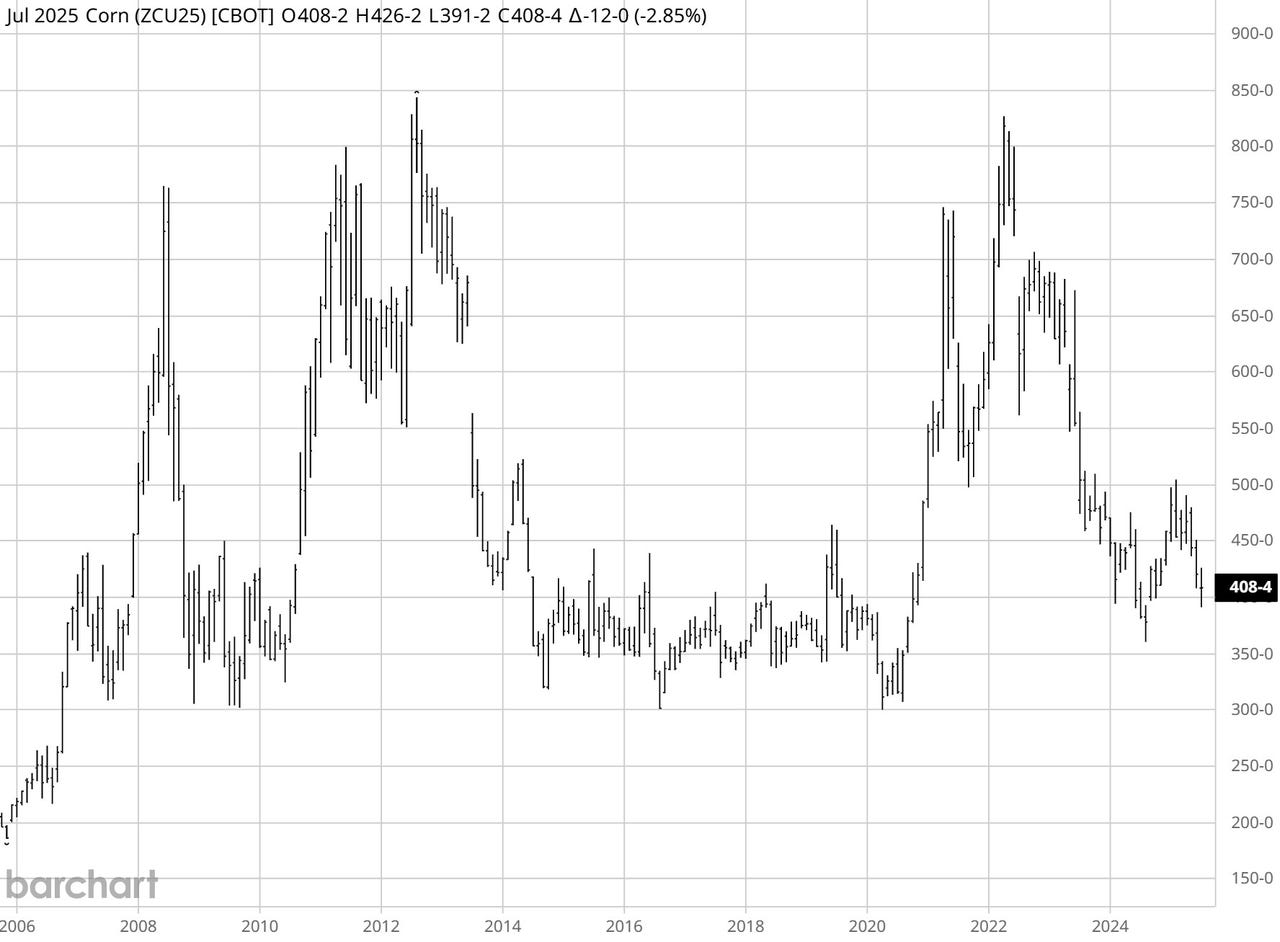
July corn traded down to $3.91¼ after going into delivery, taking the nearby below $4 for the first time in a year. Nearby soybeans also broke psychological barriers at $10, touching $9.93 before rebounding last week. That may just be the beginning if rumblings of monster crops come true.
The first hard data about this year’s production must wait until USDA’s first surveys of farmers and their fields come out Aug. 11. And these reports are just the start of estimates, which take months, if not years, to finalize.
Markets can’t wait that long, of course. And just because prices go down doesn't mean they can’t reverse back higher. But before planning for better it’s wise to make sure your operation can withstand the worst in the annual vows between man and nature.
To forego “burying the lead,” any further, here it is: Long-time chart support—$3 corn and $8 soybeans—could be in play if bears roar and feast on remaining bulls. Here’s how it could happen.
Data sees big yields
Available evidence halfway through the growing season suggests few significant problems so far, and weather forecasts aren’t threatening either. To be sure, the Vegetation Health Index did slip slightly last week, but that’s par for the course now.
My models based on the VHI are still very optimistic: 183 bushels per acre for corn, 53.2 bpa for soybeans.
USDA’s July 11 World Agricultural Supply and Demand Estimates punched in corn yields at 181 bpa corn and 52.5 bpa soybeans as placeholders “based on a weather-adjusted trend model” assuming normal weather and planting progress.
Weekly Crop Progress ratings from the government are even more enthusiastic. USDA said:
- 74% of corn fields are in very good/excellent condition, 13% above the long-term average.
- Soybeans improved to 70%, 15% better than 1986-2024.
This metric suggests corn yields of 188.9 bpa are possible, with soybeans at 54.8 bpa. Statistical error adds only a tenth of a bushel to soybean yields, but swells corn to 199.4 bpa.
Cheap crop prices increase demand
Based on the government's July estimates of harvested acreage, a corn crop of 16.4 billion to 17.7 billion bushels isn’t out of the question, with soybeans up to 4.53 billion bushels. Record-making, each one.
Soybean supplies left over at the end of the 2025 marketing year Aug. 31, 2026, could swell to 560 million bushels, 250 million more bushels than USDA’s July guess.
Bigger crops normally mean larger usage, too, though this is a double-edged sword: Demand goes up because prices are cheaper. My pricing models adjust for these factors—it’s a lot of math, but not exactly rocket science, so ranges are sometimes useful.
Here’s what the tape could do to your bottom line. (Spoiler alert: Prices the black boxes spit out are all unprofitable, assuming normal costs, including adjustments for overhead, depreciation and capital replacement, as well as family living expenses and management.)
- Futures prices could average $9.80 under this scenario, with the low end from $8.20 to $9.
- These are based on closing prices, so it’s not hard to imagine an interlay low around $8. The closing low from August 2018 was $8.33.
How low can corn prices go?
“Look out below!” is also the watchword for corn growers. Initial support on price charts comes in at the $3.64 low from a year ago. After that, an air pocket lurks.
Monster crops could threaten a price break toward $3, matching the bottoms from 2020, 2016 and 2009. Even that line in the sand might not hold under the burden of billions of bushels of unwanted grain.
- Weak demand could bring a low end from $3.15 to $3.30.
- Stronger usage could support $3.20 to $3.45.
Of course, yields may not be as robust as models warn. In that event, if demand stays as strong —a big “if”—last year’s$3.64 low could be a magnet.
Three reasons to hope for higher prices
Is there more hope for the market?
- Crop conditions could always deteriorate. Late season heat and moisture and early frost, not to mention inaccurate readings from forecast mechanisms like Crop Progress and the VHI could mean the market’s gloom is overblown.
- Trade deals from partners negotiating to avoid the worst of the Trump Administration’s tariffs could give demand an unexpected shot of adrenaline.
- A livestock sector recovery from Avian flu and drought across the Plains might do the same for feed demand.
Otherwise, picking a bottom may be more important than waiting for a top if you plan to use futures or options in hope of trading profits from post-harvest marketing strategies.