Farmers well know the importance of good roots. For USDA statisticians, another kind of root figures into how market expectations for this year’s corn and soybean acreage numbers will shake out — and by extension, what direction markets take.
The “root mean square error,” a statistical measure based on past performance of certain crops, was explained in the June 30 Acreage report. For those who go look, get out your scouting shovel. The explanation is buried near the bottom of the report.
Here’s the headline: The root mean square error is calculated by expressing the deviations between the planted acreage estimates and the final estimates as a percent of the final estimates, averaging the squared percentage deviations for a 20-year period (2006-25, in this case). Got it?
Not to get too deep into the statistical weeds, but this matters because as the Aug. 12 Crop Production report nears, how well “rooted” USDA’s acreage estimates are in reality will play a major role in grain price direction in coming months and, in turn, farmers’ bottom lines.
Next big market mover
The August Crop Production report is typically among the most-anticipated and market-moving USDA reports of the year because it includes the first corn and soybean yield and production estimates of the season based on farmer surveys. (About 15,000 producers were surveyed for last year’s August report.)
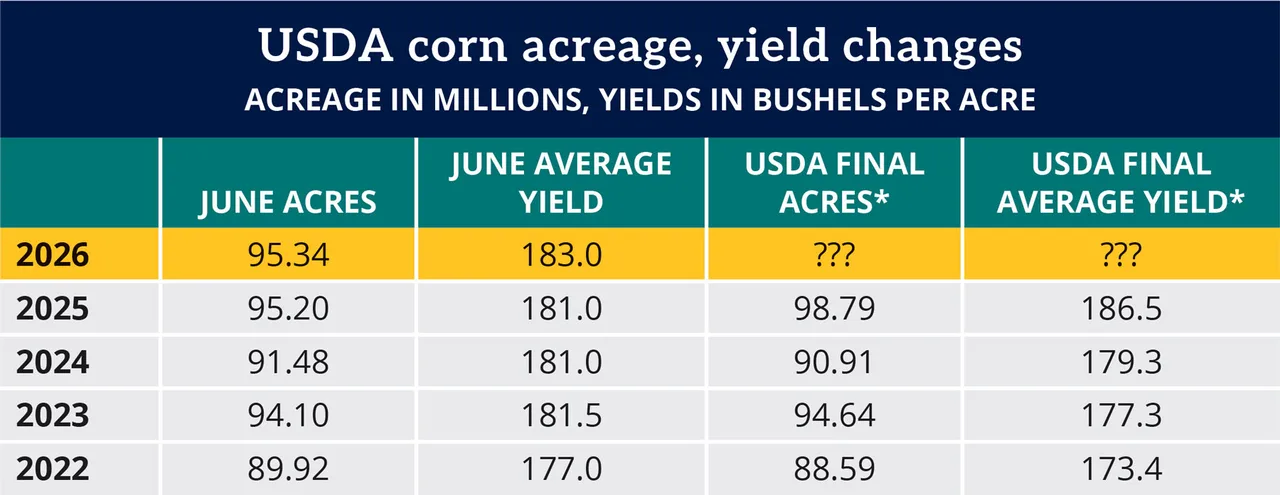
In June, USDA unexpectedly boosted its corn plantings estimate to 95.34 million acres, down 3.5% from the nine-decade high in 2025. That acreage number is unlikely to change in August. But perhaps the most pivotal numbers will be average nationwide yields, which will be plugged into acreage to calculate estimates for the fall harvest and help sharpen the overall supply picture for 2027.
Currently, USDA is using a trend-line corn yield estimate at 183 bushels per acre. Chances are that number will change, at least a little bit, depending in part on the impact of July weather on pollination. How much might it change? This takes us back to our “roots.”
In the June Acreage report, USDA said its root mean square error for estimated corn plantings is 1.4%, meaning chances are 2 out of 3 that the current corn acreage will not be above or below the final estimate by more than 1.4%. Chances are 9 out of 10 (a 90% confidence level) that the difference will not exceed 2.5%. (Note: USDA uses root square mean error in other crop reports, as well).
Broad range on planted acreage
USDA is essentially giving itself some wiggle room between its June numbers and final acreage numbers. Some, however, argue that space is big enough to drive a 12-row combine header through. Based on the 2.5% figure, final corn plantings could come in anywhere between 93 million and 97.7 million acres.
That’s “an enormous range,” said Jon Scheve, adviser and owner of Minnesota-based Scheve Grain. “At the low end, corn futures could easily trade into the mid-$5. At the high end, prices could slip below $4. In other words, there is still a tremendous amount of uncertainty and price risk in this market,” he said.
Here are three different scenarios calculated by StoneX and based on the three aforementioned acreage estimates and a 183-bushel-per-acre trend line:
95.34 million acres. Production at 16 billion bushels; 2026-27 ending stocks at 1.96 billion bushels
93 million acres. Production at 15.57 billion bushels; 2026-27 ending stocks at 1.81 billion bushels
97.72 million acres. Production at 16.43 billion bushels; 2026-27 ending stocks at 2.64 billion bushels
Farmers may or may not be interested in the sausage-making of USDA’s statistical models. Many surely would just prefer to see the agency come up with some reasonably solid, realistic numbers and avoid last year’s whiplash-inducing acreage and production adjustments. (As a reminder, 2025 corn plantings went from 95.2 million acres in the June report to a jaw-dropping final of 98.79 million acres.)
For farmers awaiting August data, the best course of action may be a familiar one for USDA reports: Expect the unexpected.
The initial August numbers can and will change, sometimes drastically, by the time “final” results drop in January. Consider strategies and tactics that could benefit from both a bullish surprise that could present opportunities to lock in higher new-crop prices, as well as those that protect downside in the event of a bearish surprise.
When it’s USDA report day and the numbers come out, markets will respond in ways you may or may not be rooting for.