The corn market is following weather forecasts intensely as a substantial amount of corn pollination will occur by Aug. 1. In its May, June and July World Agriculture Supply and Demand reports, USDA incorporated a national trend yield projection for 2026 production. Starting this week and continuing into early August, however, the USDA will conduct its first survey-based estimate of 2026 corn yields that will be released in crop production reports on Aug. 12. Combined with the latest harvested acreage estimate, USDA will arrive at a national production forecast.
As traders, our goal is to examine the accuracy of the August USDA corn yield in relation to the final estimate.
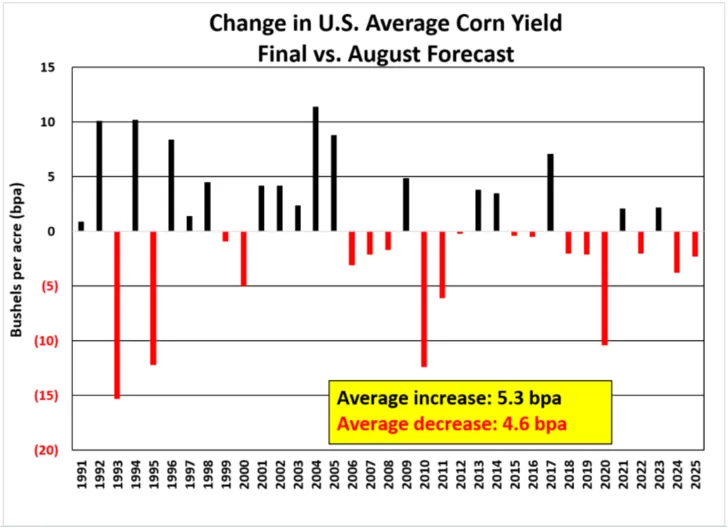
The chart below shows changes in national average U.S. corn yield from the August report to the final estimate from 1991 to 2025.
- The final yield was higher than the August forecast 17 times and lower 18 times.
- The average increase was 5.3 bushels per acre, ranging from 0.9 bushels in 1991 to 11.4 bushels in 2004.
- The average decrease has been 4.6 bpa, ranging from 0.2 bushels in 2012 to 15.3 bushels in 1993.
With harvested acreage currently pegged at 87.4 million acres, the 2026 crop could—on average— increase 460 million bushels or decrease 402 mbu from the August USDA forecast.
Weather blows around yield predictions
Uncertainty about yields this year is quite high given the contrasting weather trends. For example, above-normal rainfall and cooler-than-normal temperatures were seen across most of the Midwest during June. More recently, however, much above-normal temperatures and below-normal rainfall have been noted during July—particularly in parts of the Northern Plains and western Corn Belt.
Soybean yields: Drop or bounce?
History shows soybean yields can also still change significantly before harvest. There have been years when bean crop condition ratings have been extremely high in late-July, only to have late season dry weather and/or pests decimate yields. Alternatively, there have been instances when an average-looking bean crop rebounded to generate higher-than-expected yields due to ideal weather in late summer
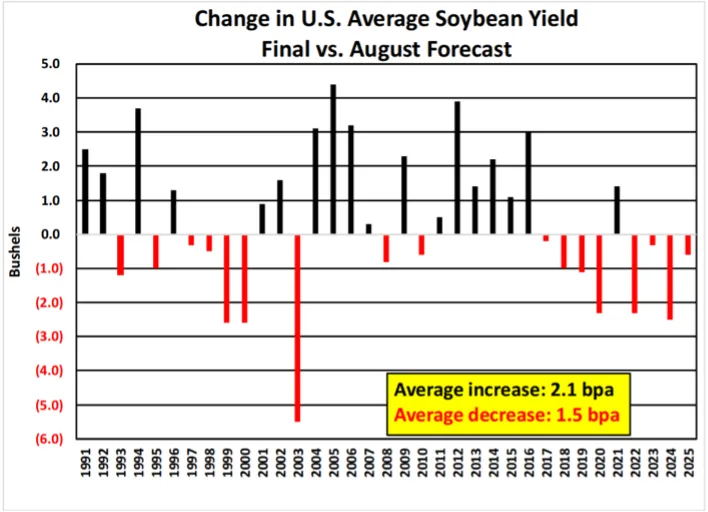
For review, the chart below shows the change in the national average U.S. soybean yield from the August report to the final estimate between 1991 and 2025.
- Final yield was higher than the August forecast 18 times and lower 17 times.
- The average increase was 2.1 bpa, ranging from 0.2 bushels in 2007 to 4.3 bushels in 2005.
- The average decrease was 1.6 bpa, ranging from 0.2 bushels in 2017 to 5.5 bushels in 2003.
With harvested acreage currently pegged at 82.5 million acres, the 2026 crop could—on average—increase 177 mbu or decrease 127 mbu from the August forecast.
Soybean crop conditions were initially quite choppy after being first reported at the end of May. A modest increase was seen into mid-June before briefly moving significantly lower into late June. Ratings have since improved for two consecutive weeks, although most believe they could edge lower again following recent warmer and drier trends. At the moment, heightened uncertainty abounds about the potential impact of warmer and drier-than-normal weather on pod fill during August in parts of the Midwest, which is supporting prices.
From a marketing perspective CZ26 corn futures were back this past week to within 15 cents of the May 13 high, while last week SX26 soybeans surpassed the high of $12.14, also made on May 13. This created opportunities for additional sales on 2026 crop, since the last time we were up at these levels a lot of the farmers were still planting.
While the crop is not “made” a good portion of the corn has pollinated and will be filling ears while the soybeans are setting/filling pods now. While I write this piece the soybean market is taking back all of the gains from the past week and is back down near that 5/13 high. While plenty of uncertainty exists around crop size here in the U.S., volatility in crude oil continues, and war rages in the Middle East and Ukraine, controlling your marketing should be center stage right now.
Market 2027 grain crops?
The current marketing opportunities and volatility should push farmers to look ahead to 2027. CZ27 futures topped $5 last week, which was about 13 cents off the contract high, also made on May 13. SX27 futures on the other hand made new contract highs at 11.9725 on July 23 – before erasing the whole week’s worth of gains in one day. While many inputs may not be locked in yet for 2027 crop plans, some will be soon and with these prices it is worth looking at and trying to lock at least some pricing opportunities in now if you keep flexibility built into those sales.
Plenty can and will change before crop tours start and harvest is underway. Taking advantage of the current opportunities to price grain and protect unpriced bushels is key to managing your portfolio. Be aware of, perhaps get offers in, or consider starting on 2027 crop opportunities to take advantage of recent volatility well before you plant that crop.
Getting a floor in place and keeping upside ability intact keeps you rooting for higher prices with the peace of mind of also knowing you have protected against a worst-case scenario. Don’t let what you read, or the prediction of others alter your course. Regardless of when opportunities arise, strike while the iron is hot.