The average Oklahoma wheat price for the past 16 years (2009-10 through 2024-25 marketing years) is $5.75. The average Texas wheat price, for the same period, is $5.83. Current wheat prices are about $1.25 below average. The 2025-26 hard red winter (HRW) wheat stocks-to-use ratio is projected to be 50%, which is the same as the 16-year average.
Wheat price history implies that farmers should expect below-average prices for several years. However, the U.S. and world supply and demand situation, as measured by the STU ratios, may imply that wheat prices should be closer to average. But I would still bet on below-average prices.
.gif?width=1280&auto=webp&quality=80&disable=upscale)
For the last 16 years (June 2009 through October 2025), Pond Creek, Okla., wheat prices averaged $5.80 (Figure 1). The highest price was $13.13 (May 17, 2022) and the lowest price was $2.58 (Aug. 31, 2016).
At this writing, the cash price of wheat in Pond Creek is $4.50 (KEZ25 – $0.70). Wheat may be forward contracted for 2026 harvest delivery at Pond Creek for $5 (KEN26 – $0.60). The wheat price in Perryton, Texas, is $4.25 (KEZ25 – $0.95), and the 2026 harvest contract price is $4.75 (KEN26 – $0.85).
For both Pond Creek and Perryton, there is a 50-cent spread between the current cash wheat price and the harvest forward contract price ($5 – $4.50). This implies that the market is predicting that June 2026 wheat prices will be 50 cents higher than current wheat prices and 80 cents below the 16-year average price.
Starting in June 2009, wheat prices were below average until Aug. 16, 2010 (one year) (Figure 1). Prices remained above average from Aug. 16, 2010, until mid-January 2015 (5 ½ years). Wheat prices, except for a few days, then dipped below average from mid-January 2015 through December 2020 (five years). Wheat prices rose above average from January 2021 until June 20, 2024 (3 ½ years), when they again dropped below average (one year).
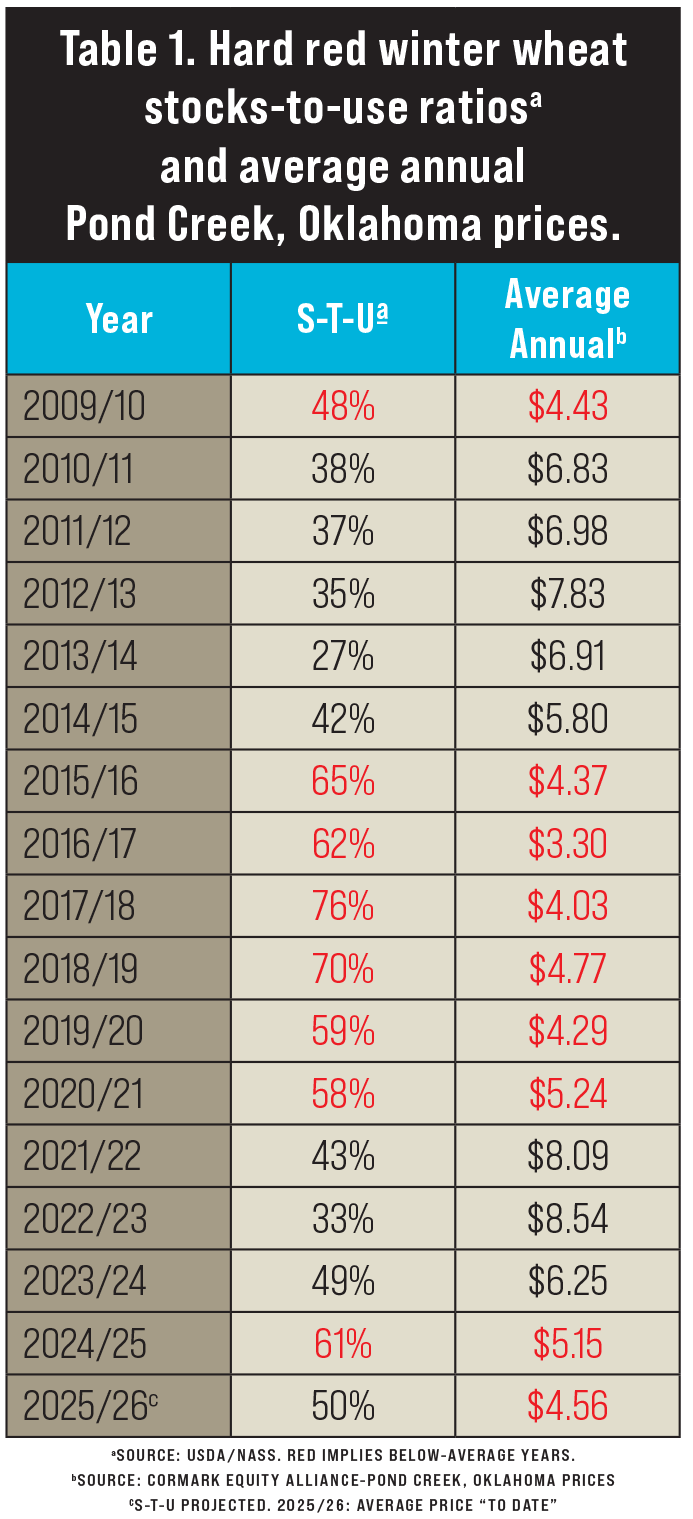
The above-average prices from January 2021 through December 2024 were distorted by the COVID-19 pandemic and then the Russia-Ukraine war. These price distortions are apparent when comparing the 42% STU ratio and average annual price of $5.74 in the 2014-15 marketing year with the 43% STU ratio and the average annual price of $8.09 in 2021-22. The distortions continued into the 2023-24 marketing year, with a STU ratio of 49% and average annual price of $6.25. This data should be interpreted with caution.

Changes in U.S. HRW wheat STU ratios partially explain the above- and below-average annual prices (Table 1). The average HRW wheat STU ratio has been 50% for the past 16 marketing years (2009-10 through 2024-25).
For the below-average price years, the average STU ratio was 61%. The lowest STU ratio was 48% ($4.43) in 2009-10, and the highest STU ratio was 76% ($4.03) in 2017-18.
For above-average price years, the average STU ratio was 38%. The highest STU ratio was 49% ($6.25), and the lowest above-average STU ratio was 27% ($6.91).
The 2025-26 wheat marketing year STU ratio is projected to be 50%. For the 2009-10 wheat marketing year, the STU ratio was 48%, and the average annual price was $4.43.
Wheat prices tend to be above or below average for several years at a time. Following 5 ½ years of above-average prices, wheat prices have been below average for 1 ¼ years. It may be expected that wheat prices will remain below average for several more years.The odds are against predicting prices. However, based on the STU ratios, if I had to bet on above- or below-average wheat prices for the near future, I would bet on below-average prices.