Class III milk futures have been trending lower for four months as U.S. milk production remains robust. Class III September 2026 milk futures have lost over $3 in that time frame. Prices peaked at $19.41 on April 28, sliding down to a recent low of $16.28 in late August.
What will the future hold for milk prices? Production remains strong, yet uncertainty lies ahead with trade wars escalating, and now grain prices are increasing.
Nothing ever changes if nothing ever changes. That’s the milk market right now. Class III milk prices have soured in recent months as the glut of milk production continues.
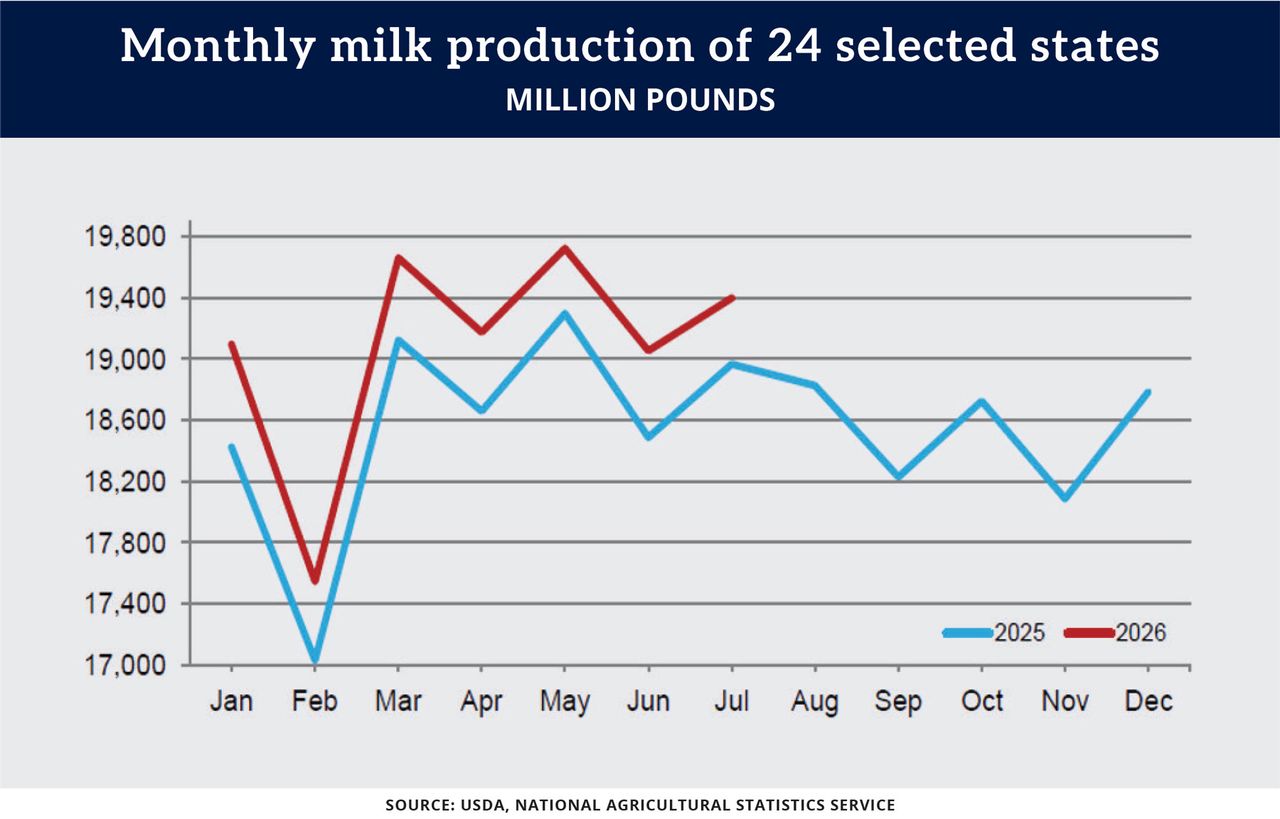
The most recent milk production report from USDA said July milk production climbed 2.2% year over year. This increase has been a theme so far for 2026. There is more milk production because there are more cows milking than years prior. The report also showed that cow numbers increased 199,000 head year over year to 9.71 million head. There appears to be no signs of slowing dairy expansions across the United States.
From a marketing perspective
Looking at the details of the report, USDA reported that milk production during July climbed to 20.1 billion pounds, up 2.2% from July 2025 and up from 19.83 billion pounds produced in June. Milk per cow was up 3 pounds from a year ago but was 33 pounds higher than June to 2,075 pounds per cow.
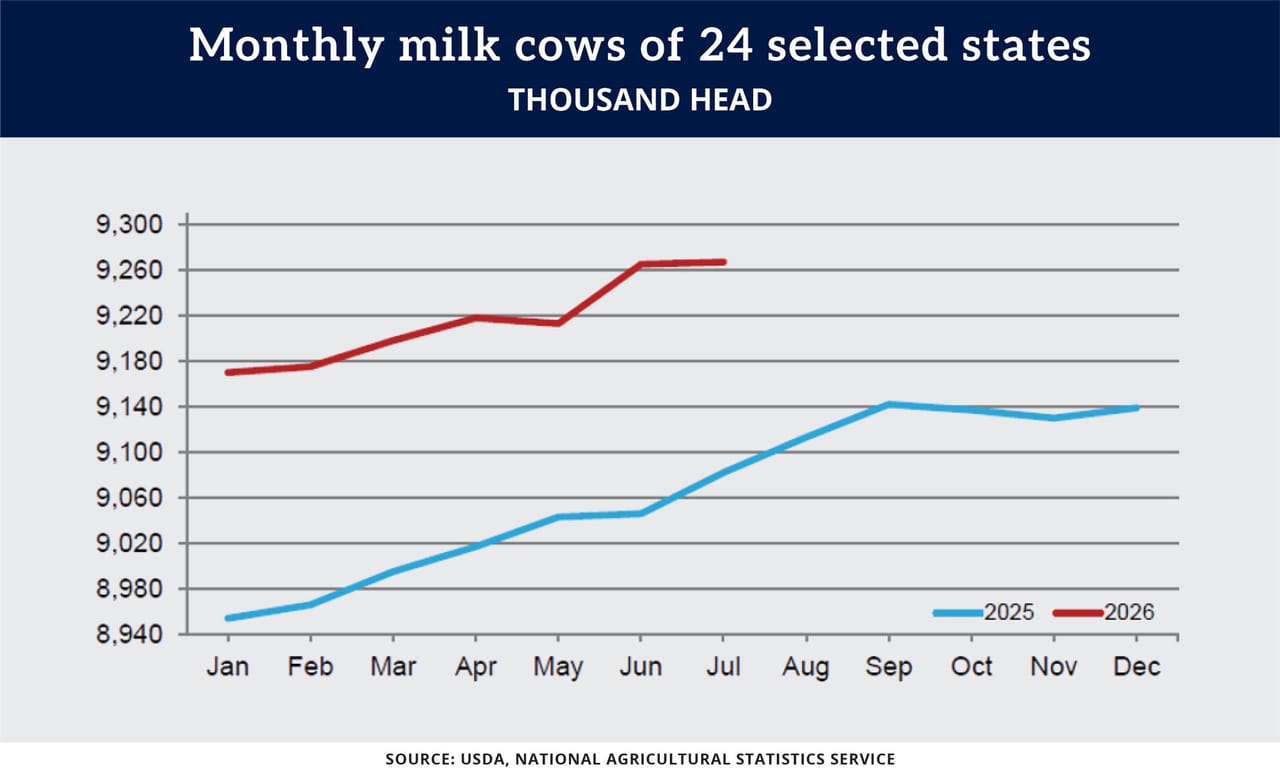
Cow numbers continue to increase. The demand for beef-on-dairy calves is insatiable, thus keeping older cows in production for much longer than normal. The milk production report for July showed that the U.S. dairy herd was nearly unchanged from June at 9.71 million head but saw an increase of 199,000 head year over year.
Where’s all that milk going? Into cheese. The most recent USDA cold storage report showed monthly U.S. cheese in cold storage at the end of July 2026 totaled more than 1.43 billion pounds. This was up roughly 1% from a year ago. This was the first month since January where cheese inventory was up year over year. Higher production for milk is starting to show as higher production levels in cheese.
Prepare yourself
While domestic demand for dairy products remains strong thanks to the protein craze, export demand is starting to take a slight hit. U.S. dairy exports in June totaled 248,474 metric tons, down 2% from May 2025 and 5% lower from the previous month. The next official report will be released Sept. 3.
Where do our dairy exports go? All over the world. Top customers include Mexico, Canada, Japan, China, South Korea, Philippines, Australia, European Union, Indonesia and Colombia.
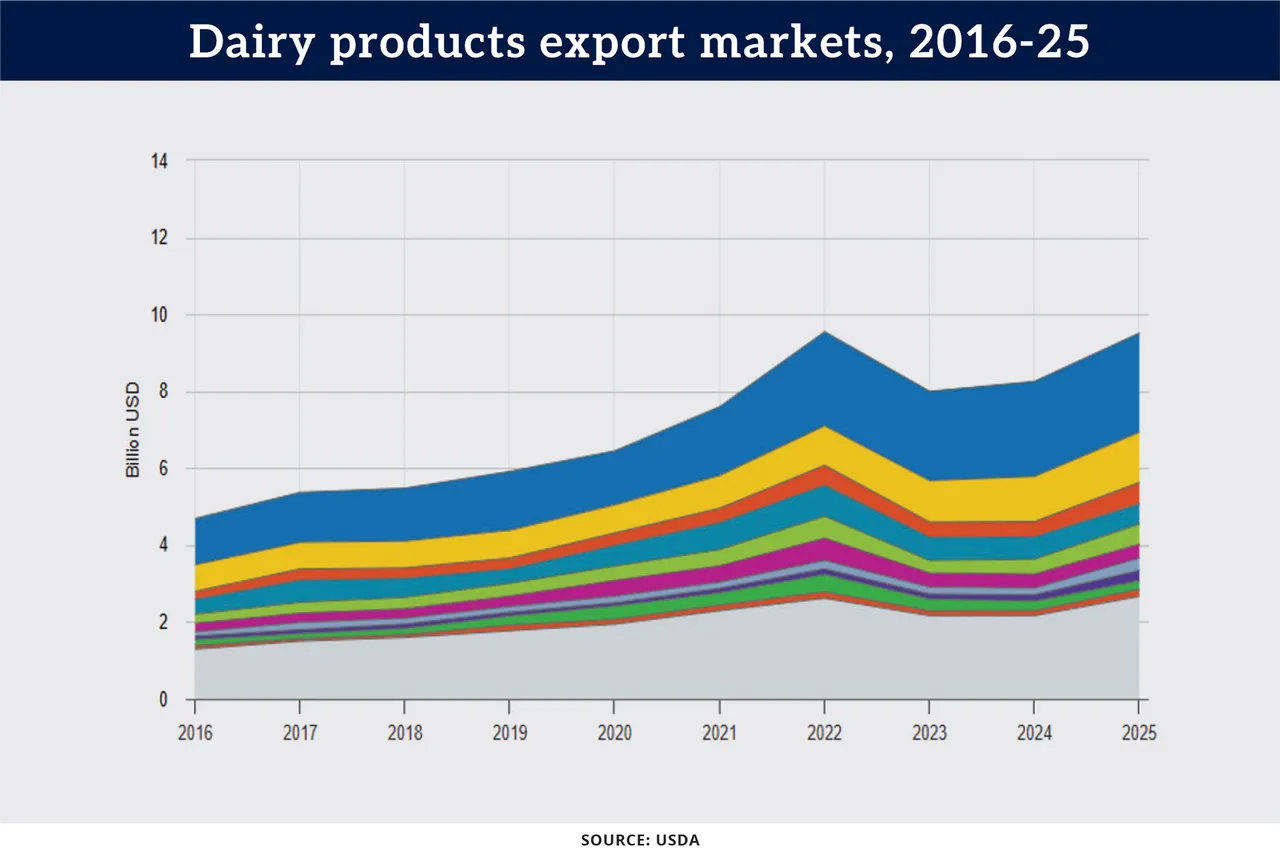
Take note, Canada is our second-largest buyer of U.S. dairy exports, and trade negotiations with them are now up in the air. U.S. dairy exports to Canada last year topped $1.3 billion, according to the USDA.
Recently, the Canadian government suggested new tariffs ranging from 15% to 50% on many U.S. products, including dairy, fish and aquaculture, lumber, and aluminum steel. These would go into effect Sept. 8.
Specifically for dairy, Canada imposed a 50% tariff on milk and cream. Canada placed 25% tariffs on cheese (and some curd), which amounted to $135 million in U.S. exports last year, according to USDA. Canada also placed 50% tariffs on a range of whey products, which accounted for $82.6 million in U.S. dairy exports last year.
The future for dairy prices might be a bit murky. Milk production is ample. This will likely keep a lid on any potential rally. Exports with our second-largest trading partner may be in jeopardy. Stay defensive for now. But with the recent rally in the grain market, an increase in feed prices may start to be the catalyst for change.
Disclaimer: The data contained herein is believed to be drawn from reliable sources but cannot be guaranteed. Individuals acting on this information are responsible for their own actions. Commodity trading may not be suitable for all recipients of this report. Futures and options trading involve significant risk of loss and may not be suitable for everyone. Therefore, carefully consider whether such trading is suitable for you in light of your financial condition. Examples of seasonal price moves or extreme market conditions are not meant to imply that such moves or conditions are common occurrences or likely to occur. Futures prices have already factored in the seasonal aspects of supply and demand. No representation is being made that scenario planning, strategy or discipline will guarantee success or profits. Any decisions you may make to buy, sell or hold a futures or options position on such research are entirely your own and not in any way deemed to be endorsed by or attributed to Total Farm Marketing. Total Farm Marketing and TFM refer to Stewart-Peterson Group Inc., Stewart-Peterson Inc., and SP Risk Services LLC. Stewart-Peterson Group Inc. is registered with the Commodity Futures Trading Commission (CFTC) as an introducing broker and is a member of National Futures Association. SP Risk Services, LLC is an insurance agency and an equal opportunity provider. Stewart-Peterson Inc. is a publishing company. A customer may have relationships with all three companies. SP Risk Services LLC and Stewart-Peterson Inc. are wholly owned by Stewart-Peterson Group Inc. unless otherwise noted, services referenced are services of Stewart-Peterson Group Inc. Presented for solicitation