Grain futures prices had a strong rally during third quarter, with oat futures also going along for the ride, gaining nearly $1 during that time. The theme of potentially smaller supplies of global grains in 2027 is also a potential theme for oat futures.
What’s happened
If you’ve been around agricultural commodity futures for a while, you probably are familiar with one of the two old oat adages: “Oats know” and “Oats know where corn goes.”
The notion behind these sayings stems from many years ago, before high-frequency computer trading and before the trading world was so volatile and globally linked. Years ago, traders used to watch “other” indicators tied to grain markets in order to determine potential overall grain commodity price direction. The idea is that oats are more of a pure market — not influenced as much by fund money or noncommercial traders, and traded primarily on actual oat market supply-and-demand fundamentals.
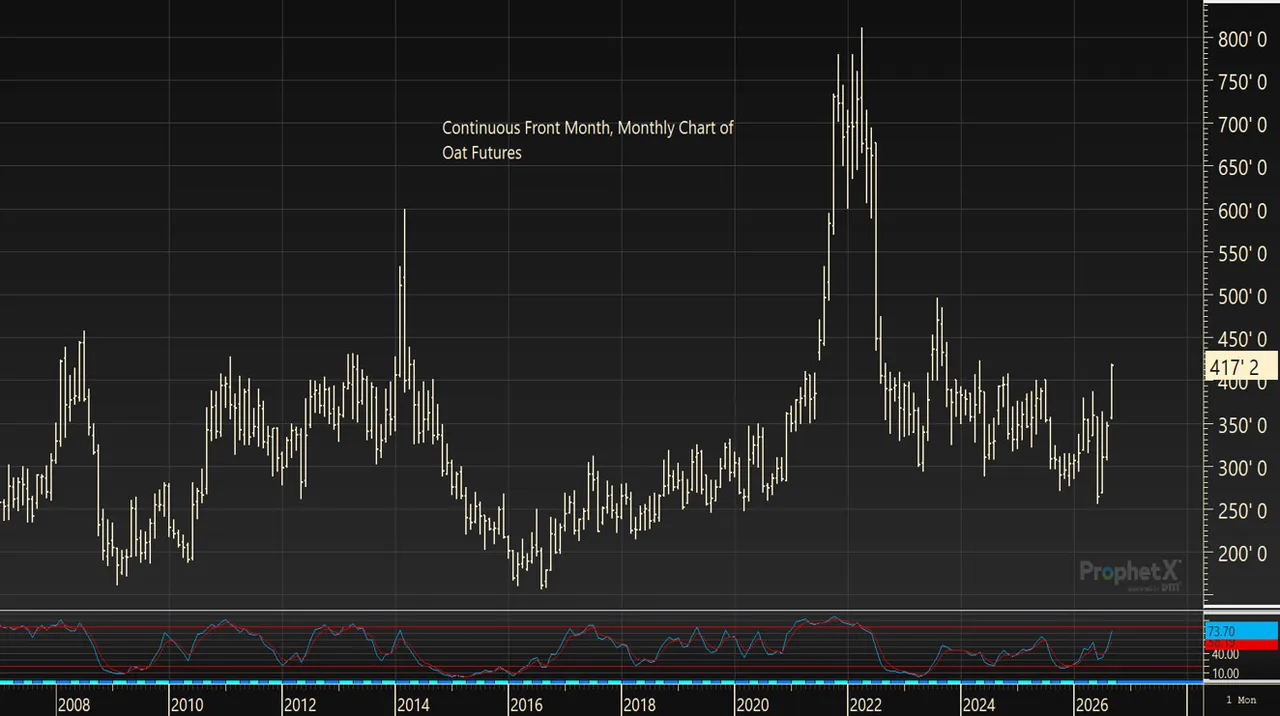
While the correlation cannot in any way be perceived as gospel, it is something that traders keep an eye on. As of this writing, corn futures have traded in a sideways pattern for nearly three weeks, while oat futures have quietly moved higher, climbing over the $4 price resistance area that held it captive for nearly two years.
From a marketing perspective
Oat futures gained traction recently when Stats Canada’s production report pegged oat production for 2026 at 3,031 thousand metric tons, down from 3,920 thousand metric tons in 2025. That’s nearly a 20% decrease in production. This is also down from 3,358 thousand metric tons in 2024. That is important to be aware of as Canada has the world’s second-largest oat production.
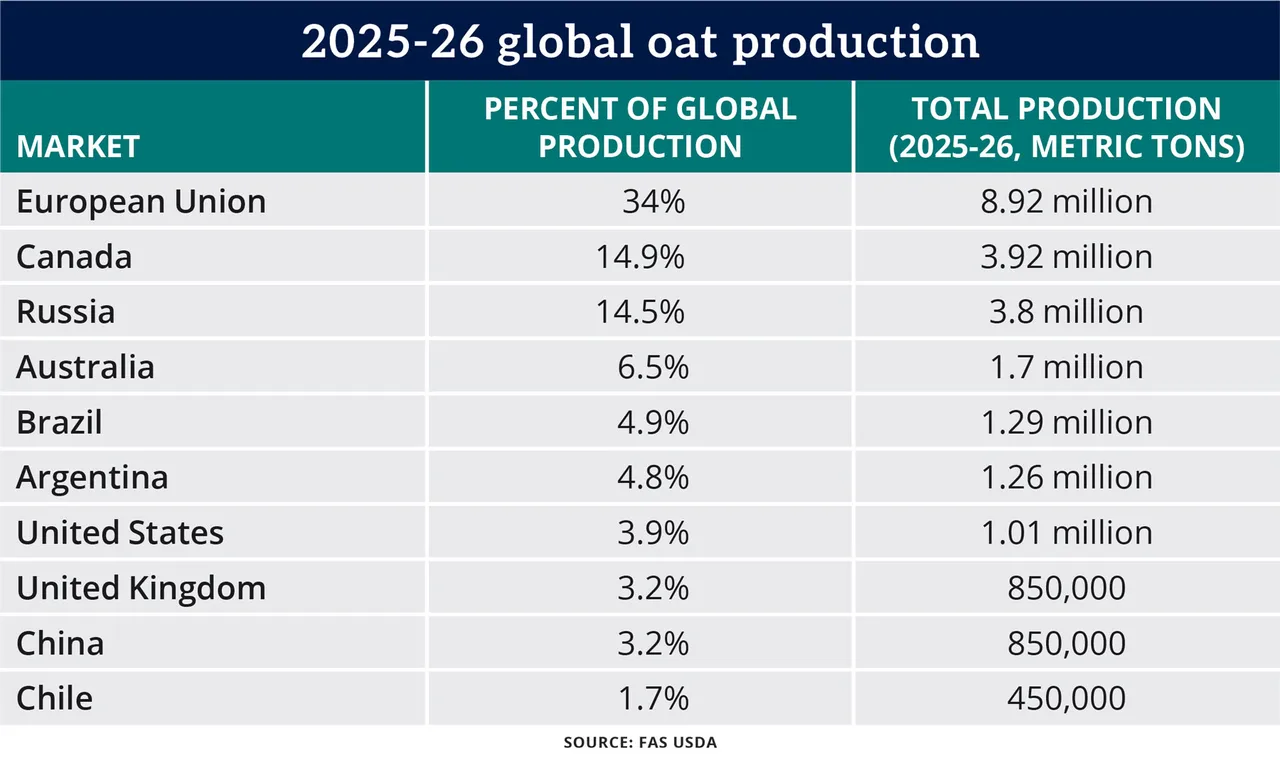
Below is a view of the top global growers of oats from the 2025-26 crop year. Notice the U.S. is seventh on the list.
For the 2026-27 crop year, USDA pegs U.S. planted oats at 2.7 million acres, with production marked at 68 million bushels. When reviewing data for this blog, I did not realize the U.S. is actually a net importer of oats! The U.S. imports 72 million bushels of oats (primarily from Canada), and our domestic consumption is 138 million bushels. Ending stocks are currently marked at 32 million bushels, in line with last year, yet historically on the smaller side.
Prepare yourself
Grain futures, including oats, have had a fabulous price rally throughout the third quarter as global production edged lower due to this summer’s adverse weather.
Oat futures will have fresh fundamental information in the days ahead thanks to the USDA Quarterly Stocks and Small Grains Summary, due out next week, Sept. 30. We’ll have to wait and see if and exactly what “oats know.”
Disclaimer: The data contained herein is believed to be drawn from reliable sources but cannot be guaranteed. Individuals acting on this information are responsible for their own actions. Commodity trading may not be suitable for all recipients of this report. Futures and options trading involve significant risk of loss and may not be suitable for everyone. Therefore, carefully consider whether such trading is suitable for you in light of your financial condition. Examples of seasonal price moves or extreme market conditions are not meant to imply that such moves or conditions are common occurrences or likely to occur. Futures prices have already factored in the seasonal aspects of supply and demand. No representation is being made that scenario planning, strategy or discipline will guarantee success or profits. Any decisions you may make to buy, sell or hold a futures or options position on such research are entirely your own and not in any way deemed to be endorsed by or attributed to Total Farm Marketing. Total Farm Marketing and TFM refer to Stewart-Peterson Group Inc., Stewart-Peterson Inc., and SP Risk Services LLC. Stewart-Peterson Group Inc. is registered with the Commodity Futures Trading Commission (CFTC) as an introducing broker and is a member of National Futures Association. SP Risk Services, LLC is an insurance agency and an equal opportunity provider. Stewart-Peterson Inc. is a publishing company. A customer may have relationships with all three companies. SP Risk Services LLC and Stewart-Peterson Inc. are wholly owned by Stewart-Peterson Group Inc. unless otherwise noted, services referenced are services of Stewart-Peterson Group Inc. Presented for solicitation