2026 has been a volatile year for crude oil futures, with price highs near $120 a barrel and low prices near $70 a barrel. Looking ahead to 2027, expect that price volatility to continue.
Current potential technical price projections are poised to either rally up to the 2008 price highs near $150 a barrel or sink lower. Technical price objectives potentially hint at values closer to $50 a barrel, levels that have not been seen since 2021.
What’s happened
At the start of this quarter, crude oil futures prices settled down a bit from summer’s dramatic price trade action. In fact, from mid-September through mid-October, crude oil futures prices traded in a relatively lackluster $10 range. Of course, traders continue to monitor global supply-and-demand fundamentals and Middle East strife against the backdrop of a major U.S. midterm election in the coming weeks.
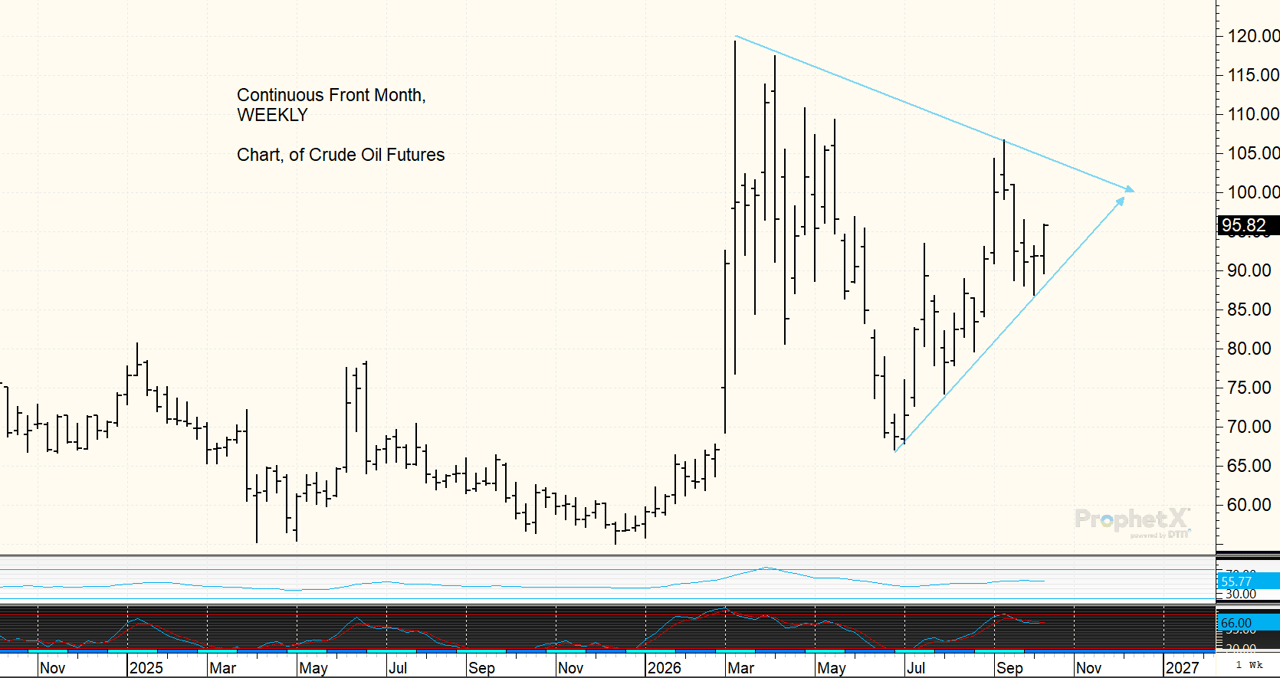
While we are enjoying this modest price reprieve for now, take note: A larger price consolidation pattern has been forming on weekly charts. It’s a pennant flag.
From a marketing perspective
While technical trading is not perfect and can be interpretive, it sometimes can assist with potential upcoming price move directions and price objectives. Nothing is for certain in commodity trading, but this pennant flag formation bears watching.
Why care about a pennant flag? The high- and low-price difference of the consolidation range often points to the potential price objective amount of the future price breakout.
Let’s take a closer look at the current pennant flag on the weekly chart above. Take note, the high price of this pennant flag stems from early 2026, when crude oil prices were trading near $120 a barrel, which marks the top of the downward channel line.
Support stems near the price low at the $70-a-barrel area, which defines the bottom of the upward channel. Notice how prices have been consolidating between the two trend lines for most of 2026.
From a technical standpoint, when we see this formation on charts, it usually indicates that a price breakout is getting ready to occur. We do not know if the price breakout will be higher or lower. Actual market fundamentals dictate the ultimate price breakout direction. But we can extrapolate what the approximate price breakout value points to for the future.
In this case, for the pennant flag, take the price difference between the top of the downtrend ($120 area) and the bottom of the uptrend support ($70 area). The price difference between those two price points is about $50. (I’m rounding to simplify the math for demonstration purposes). The juncture of the channel lines is near the $100 area.
The prices of crude oil have been pacing back and forth like a caged tiger, moving between the top of the downward channel and the bottom of the upward channel. Crude oil futures prices are getting ready to “pounce” or “break out” of this current trading formation.
Again, we do not know if the price breakout will be higher or lower, but traders might suggest that if bullish news pops up in the coming weeks, the price breakout points to an upward trajectory of $150 per barrel (add the $50 consolidation pattern to the $100 price juncture). Vice versa, if the news in the coming weeks is bearish, subtracting the $50 consolidation pattern from the $100 juncture points to a lower price point of about $50 during 2027.
Prepare yourself
Again, I do not know if the likely price breakout for crude oil futures in 2027 will be higher or lower, but based on technical objectives, the price move looks to be significant.
We have plenty of things to monitor between now abd year-end for crude oil futures: Middle East and Black Sea war tensions, the upcoming Fed meeting Oct. 27-28, and U.S. midterm elections, as well as traditional supply-and-demand fundamentals.
A potential $50 price breakout, higher or lower, into 2027 will have major significance. You need to be ready for either scenario to unfold.
Disclaimer: The data contained herein is believed to be drawn from reliable sources but cannot be guaranteed. Individuals acting on this information are responsible for their own actions. Commodity trading may not be suitable for all recipients of this report. Futures and options trading involve significant risk of loss and may not be suitable for everyone. Therefore, carefully consider whether such trading is suitable for you in light of your financial condition. Examples of seasonal price moves or extreme market conditions are not meant to imply that such moves or conditions are common occurrences or likely to occur. Futures prices have already factored in the seasonal aspects of supply and demand. No representation is being made that scenario planning, strategy or discipline will guarantee success or profits. Any decisions you may make to buy, sell or hold a futures or options position on such research are entirely your own and not in any way deemed to be endorsed by or attributed to Total Farm Marketing. Total Farm Marketing and TFM refer to Stewart-Peterson Group Inc., Stewart-Peterson Inc., and SP Risk Services LLC. Stewart-Peterson Group Inc. is registered with the Commodity Futures Trading Commission (CFTC) as an introducing broker and is a member of National Futures Association. SP Risk Services, LLC is an insurance agency and an equal opportunity provider. Stewart-Peterson Inc. is a publishing company. A customer may have relationships with all three companies. SP Risk Services LLC and Stewart-Peterson Inc. are wholly owned by Stewart-Peterson Group Inc. unless otherwise noted, services referenced are services of Stewart-Peterson Group Inc. Presented for solicitation