Were large corn export sales to Mexico this week based on value buying, or potentially to get ahead of an extreme price rally if El Niño hits South American corn production in the coming months?
What’s happened
Low prices cure low prices. The adage rings true more often than not.
October nearly saw a 60-cent price drop for corn futures. A bearish October USDA World Agricultural Supply and Demand Estimates report that showed an unexpected large increase in U.S. corn yield put the nail in the coffin for prices.
However, now that prices are back down to what many view as historically cheap values for U.S. corn futures, export demand has been brought back into the spotlight.
This week, Mexico showed up as a large purchaser of U.S. corn, with a one-day flash sale of an astounding 1.73 million metric tons for delivery to Mexico, of which 1.14 million tons are for the 2026-27 marketing year and 594,360 tons for 2027-28. This large sale was followed the next day by another 315,000-metric-ton sale to Mexico.
According to USDA data, the 1.73 million-metric-ton purchase was the ninth largest daily flash sale purchase in U.S. history.
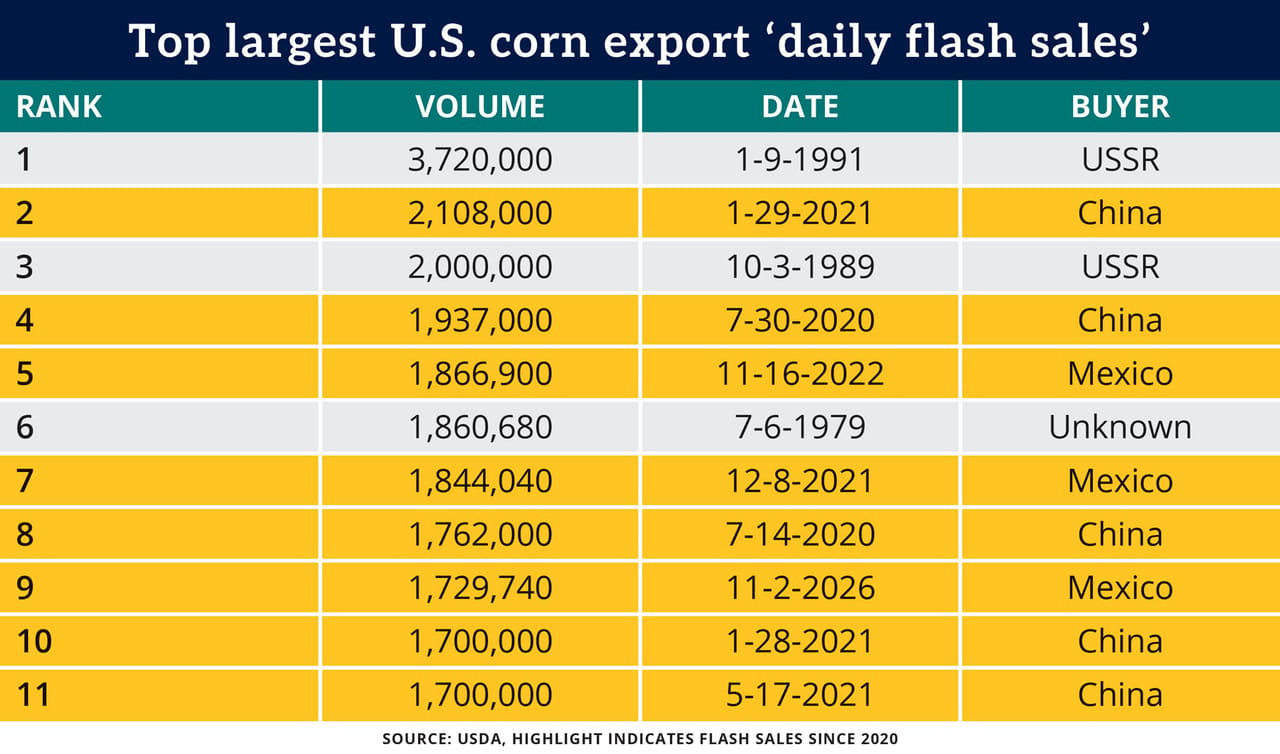
Looking at the list of the largest corn “flash” export purchases got me noticing that 8 of those 11 large-volume sales have occurred since 2020.
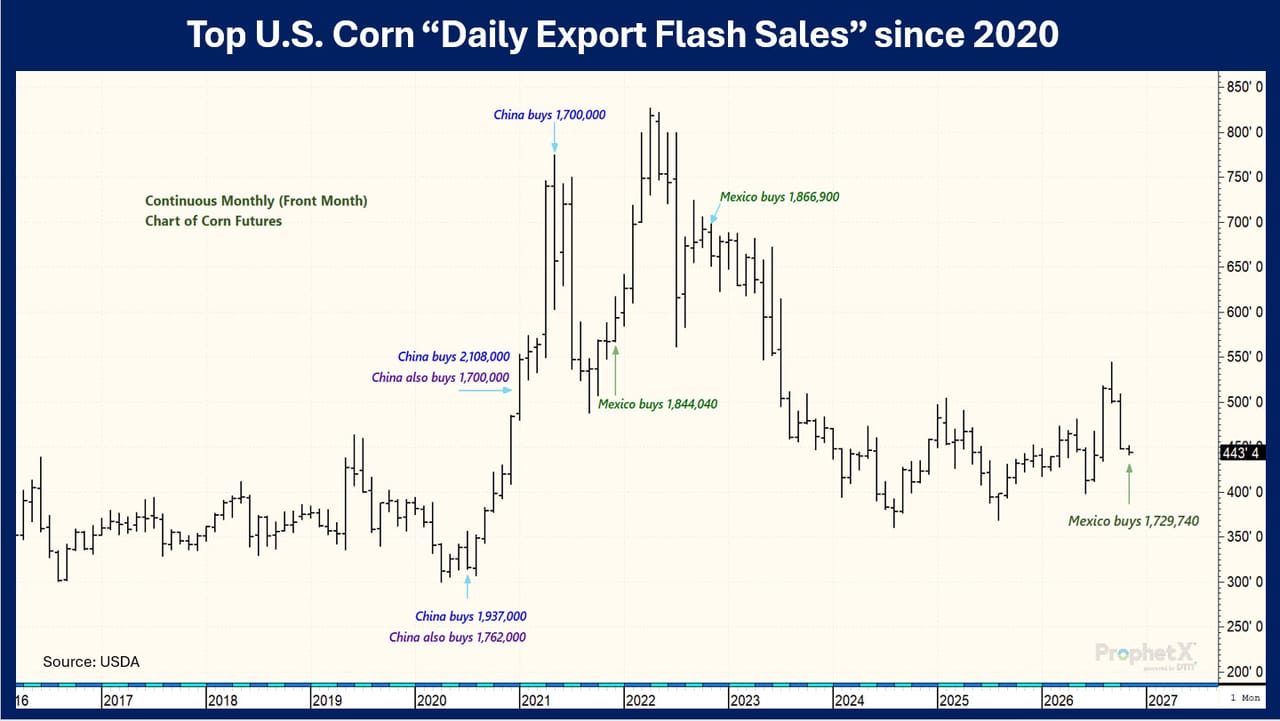
Curiosity got the best of me, and I wondered, looking back since 2020, how often were those large purchases bought near “price lows”? And what happened to corn prices after those large purchases were made?
I charted the eight purchases since 2020 out on a continuous monthly corn chart. Interestingly enough, in 6 out of the 8 purchases, China or Mexico “bought the low,” and corn futures prices had significant price rallies soon after.
From a marketing perspective
Mexico likely bought that large amount of U.S. corn this week due to the value. Quite frankly, U.S. corn is cheap. Too cheap, especially with the yield in question. (Many producers have told us that due to the extreme heat this summer, their corn yield is average at best. Many in the industry wonder if the current USDA yield number of 181.2 bushels per acre, up from 178.5 in September, is too high.)
However, I think Mexico may also be ahead of the curve — the weather curve. El Niño is still a threat as we finish out 2026 and head into 2027. If the El Niño weather pattern persists, it may mean hot and dry weather for northern and central Brazil, which could affect soybean and corn production.
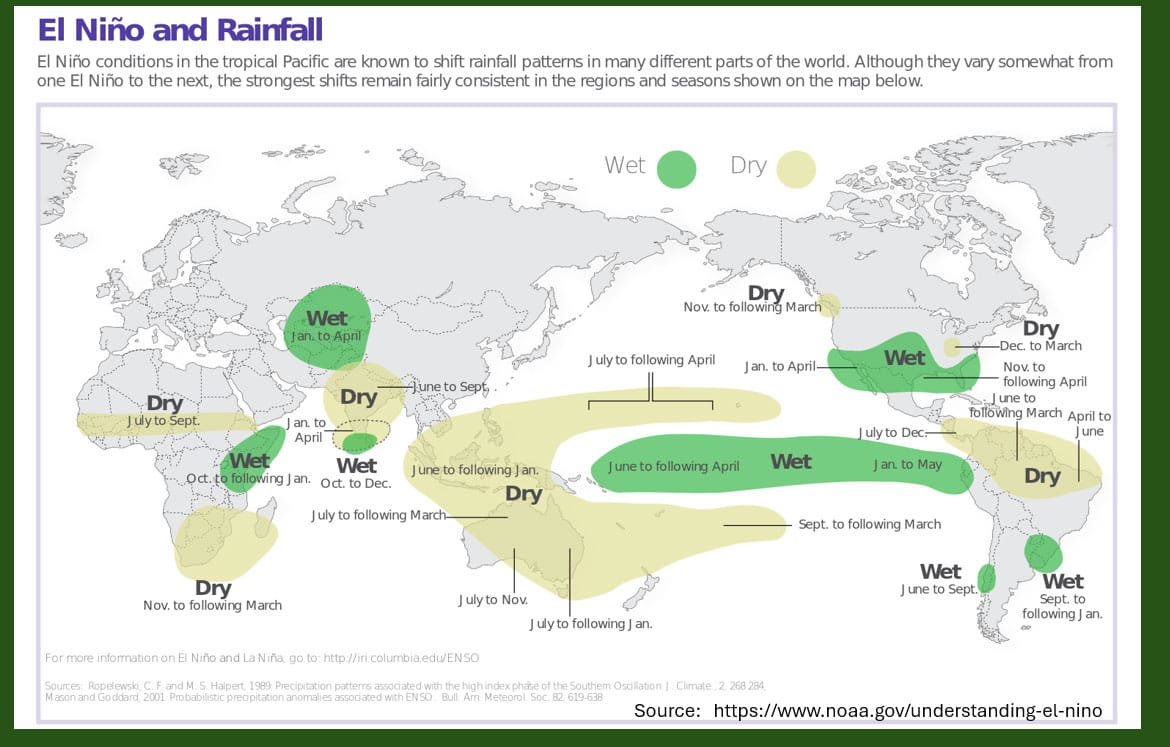
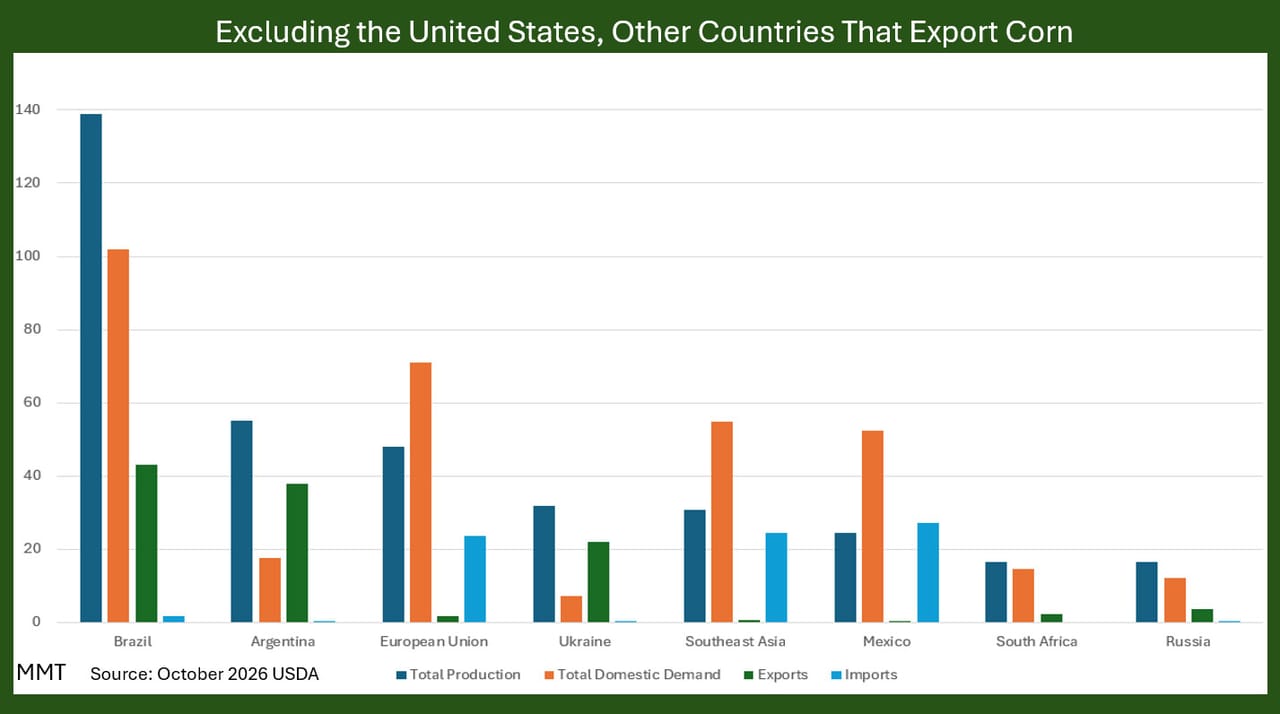
It matters how the weather is in South America, because according to the most recent USDA WASDE report, the U.S. is the world’s largest grower of corn, followed by China, then Brazil and Argentina. The U.S. is the largest exporter of corn, followed by Brazil and Argentina.
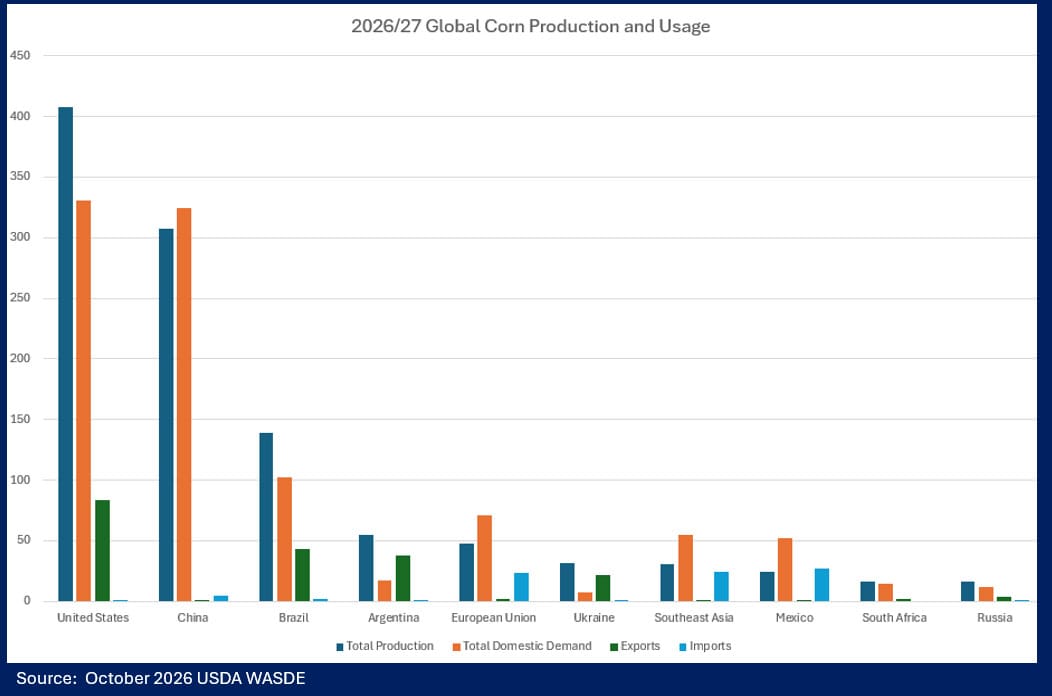
The next chart is the same chart as above, but without the U.S. and China. This gives a better view of how much corn production, usage, demand and exports come from Brazil and Argentina. Also take note, besides South Africa, Brazil and Argentina are the only major Southern Hemisphere corn growers with the ability to export excess corn. (Southeast Asia relies on imports.)
So, if a weather issue affects Brazil or Argentina in the coming months, the ripple effects could be felt around the world.
Prepare yourself
The timing of Mexico’s large U.S. corn purchases this week may very well have marked the harvest low. Will any other countries follow suit and advance their U.S. corn purchases in the coming weeks to buy on value, and ahead of a potential El Niño weather threat?
Traders will be watching daily and weekly export sales for signs of fresh demand. The corn market is extremely oversold on daily charts, with funds now estimated to be closer to neutral in the market. End users and bargain buyers may be getting ready to act.
Disclaimer: The data contained herein is believed to be drawn from reliable sources but cannot be guaranteed. Individuals acting on this information are responsible for their own actions. Commodity trading may not be suitable for all recipients of this report. Futures and options trading involve significant risk of loss and may not be suitable for everyone. Therefore, carefully consider whether such trading is suitable for you in light of your financial condition. Examples of seasonal price moves or extreme market conditions are not meant to imply that such moves or conditions are common occurrences or likely to occur. Futures prices have already factored in the seasonal aspects of supply and demand. No representation is being made that scenario planning, strategy or discipline will guarantee success or profits. Any decisions you may make to buy, sell or hold a futures or options position on such research are entirely your own and not in any way deemed to be endorsed by or attributed to Total Farm Marketing. Total Farm Marketing and TFM refer to Stewart-Peterson Group Inc., Stewart-Peterson Inc., and SP Risk Services LLC. Stewart-Peterson Group Inc. is registered with the Commodity Futures Trading Commission (CFTC) as an introducing broker and is a member of National Futures Association. SP Risk Services, LLC is an insurance agency and an equal opportunity provider. Stewart-Peterson Inc. is a publishing company. A customer may have relationships with all three companies. SP Risk Services LLC and Stewart-Peterson Inc. are wholly owned by Stewart-Peterson Group Inc. unless otherwise noted, services referenced are services of Stewart-Peterson Group Inc. Presented for solicitation