I’ve said it before and I will say it again: Predicting market direction is hazardous.
In early August I saw an outstanding Minnesota corn crop, and that led me to predict a return to June price lows by harvest. I could not have been more wrong. December ’26 corn futures ended the month nearly 80 cents per bushel higher. This 14% increase from the beginning to the end of August was easily the best August performance going back four decades.
In early September, I addressed a logical follow-up question: “Can this rally be sustained through harvest?” My crystal ball improved as I cast a skeptical eye on continued price strength. As harvest began in the Corn Belt, I was in a Missouri state of mind. Missouri is the Show-Me State, and continued price strength could only occur if U.S. actual corn yields came in at the lower numbers predicted by many market pundits. That didn’t happen. Despite a rain-delayed harvest, yields came in generally stronger than anticipated.
The price correction lower in September was greeted with a collective shrug — August was an incredible month, and the price correction was not surprising. What was surprising was the remarkable acceleration in the downtrend in October.
The end of harvest provided an opportunity to look at where we stood historically. A remarkable record and positive August price rise was followed by an equally remarkable and negative price collapse in September and October.
Let’s look at the history of years when December corn collapsed in the months of September and October. I’m looking for tendencies in the July corn contract following poor price action during harvest. Can we or should we expect a strong price recovery into the new year?
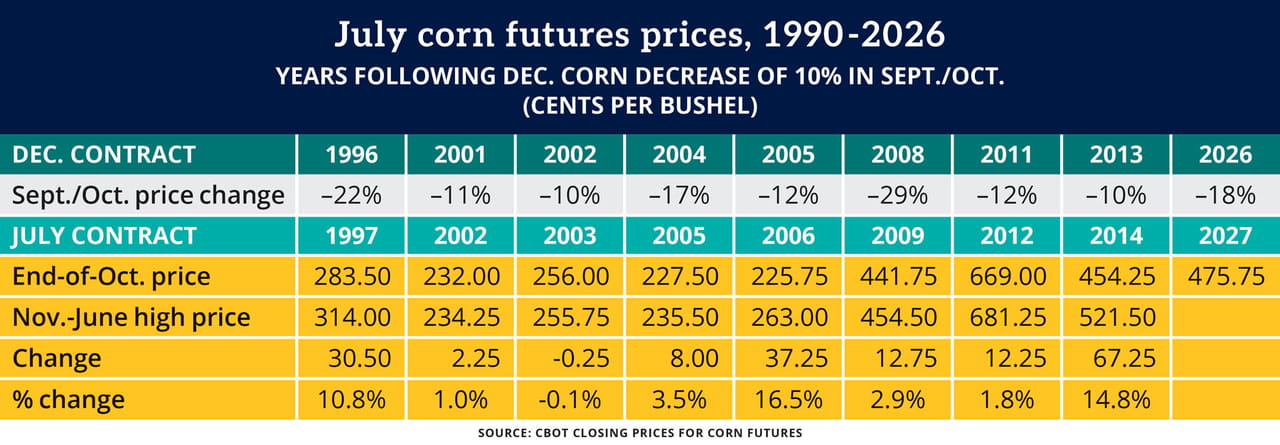
The table above shows the December contract fell by 10% in the September-October period in eight years since 1990. In five of these eight years, the July contract rebounded less than 4% from the end of October to the highest closing price in the following November-to-June time period. That is not encouraging.
The remaining three years rebounded 10% to 17%, and that looks respectable. However, this is the highest closing price in the November-to-June period. That’s the highest price. Do you anticipate selling at the highest price over the next eight months?
Analysis of this sort (sometimes called similar-years analysis) is, like all analysis, imperfect. You may be encouraged by the modestly friendly November World Agricultural Supply and Demand Estimates report. You may be anticipating (hoping?) for a super El-Niño and less-than-ideal growing conditions in South America.
What is certain is this market needs something to turn this trend around. The history reviewed here does not bode well for corn prices into the new year.