Whether it’s a first chance or last gasp, weather scares offer a potentially profitable kick at the can for corn and soybean growers’ marketing plans.
But how do you know if a price move is merely a head fake or the start of a major move, especially with a strong El Niño brewing this summer to heat up the Pacific Ocean?
Sadly, forecasting weather is just as fraught as picking tops and bottoms on the board. History provides no clear-cut answers, only hints, and precious few are “statistically significant” — that is, more likely than a 50-50 coin flip.
First off, weather causes most, but not all, summer moves. Remember England’s turbulent June 2016? You may better recall its popular moniker: Brexit. U.S. stocks tumbled to three-month lows, pulling grain markets down, too. December corn broke below $4 while November soybeans couldn’t hold $11 and $10 handles.
Middle East drama and U.S. midterm elections are the obvious potential triggers for seasonal volatility in 2026, but another bogeyman or two (maybe three) could also go bump in the night, for better or worse.
For the record, summer rallies are defined as the move from spring lows in March, April and May to highs established from June 1 to the end of the delivery month — December for corn and November for soybeans — with prices fixed on a closing basis.
Those caveats aside, here are some track records to consider when placing weather scare wagers.
Get real on returns
Summer rallies top 20% on average for both corn and soybeans. But don’t pencil those returns into cash flows. Looking under the hood often reveals a different story. The averages are distorted by some summers with huge gains. Years with drought or disruption, sometimes both — such as 1988, 2001, 2002 and 2012 — generate outsized profits that skew results.
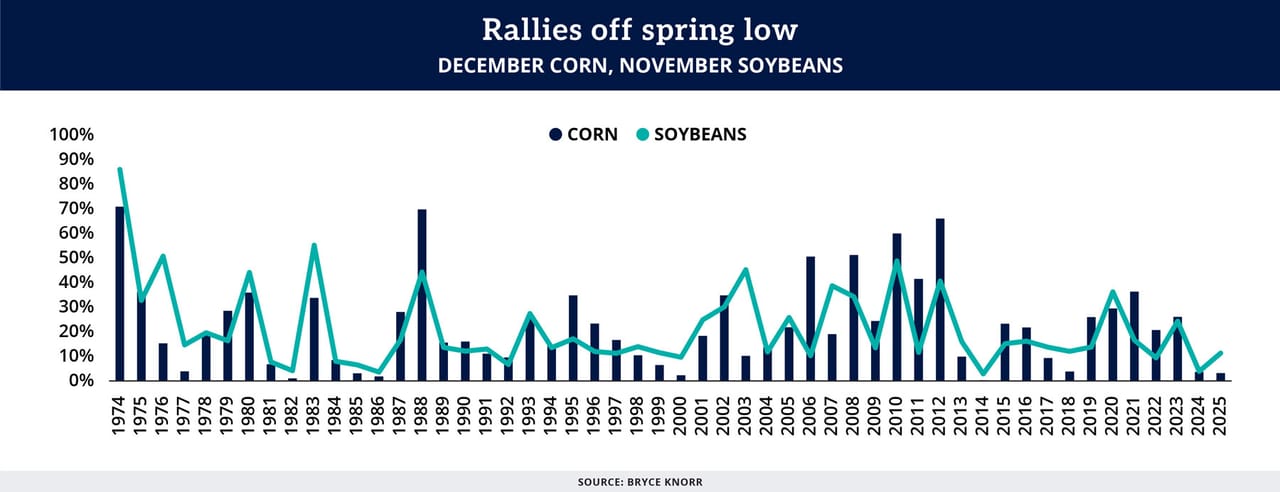
Indeed, since 1974, returns for soybeans were below that 20% benchmark more than three-quarters of the time.
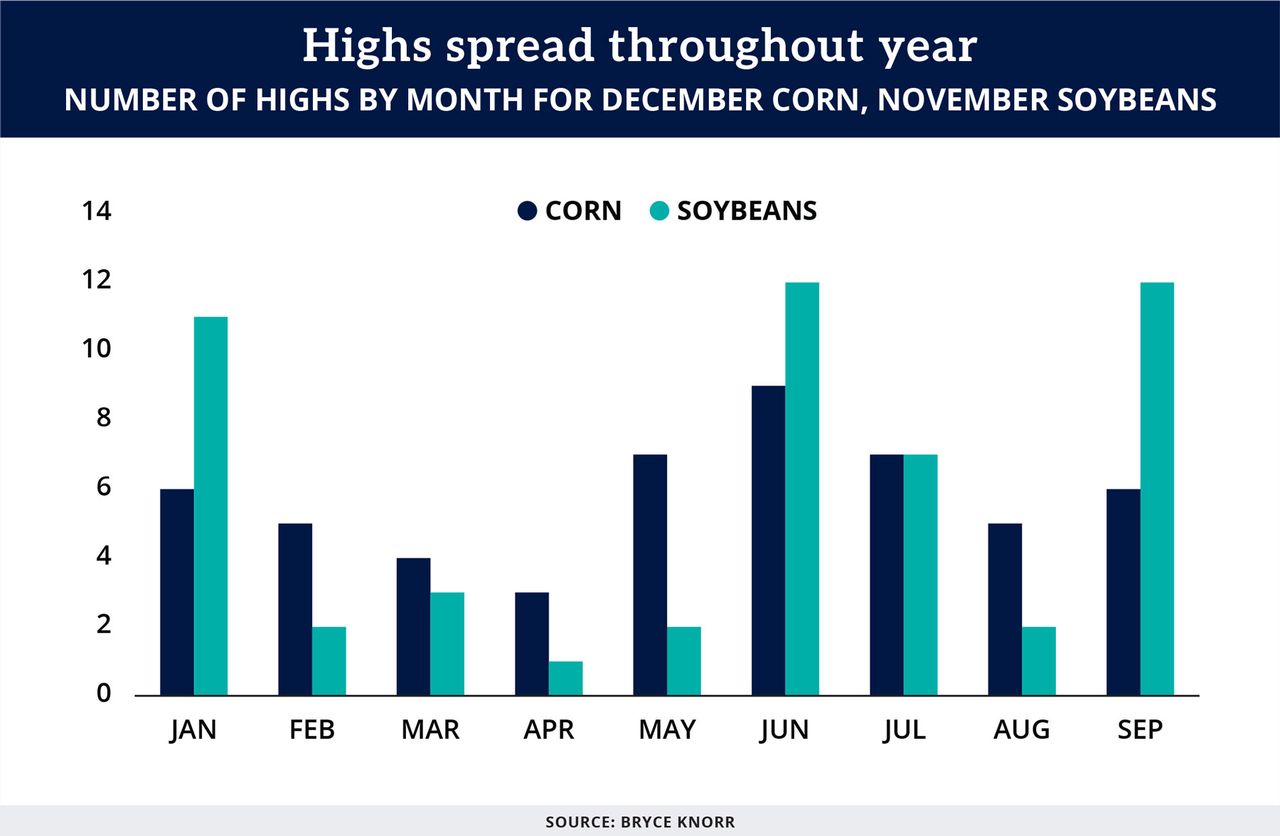
Corn fared a little better. Only three of every five summers for corn were below average, a number likely influenced by the crop’s increased risk during planting and pollination, which clustered rallies from May through July.
Soybean rallies rose in June and July but were also noted in September, due to important late-season rains, and in January, when South American production was at risk.
When to price corn?
Drilling down more into seasonal trends shows corn on average topping out around the third week of June, then rising consistently after the ball drops on New Year’s, even in years with normal production. The exception to this rule is short-crop years, when December futures tend to peak at the end of August.
November soybeans in normal years top in mid-July, with the peak in the third week of August in summers with stress. Lows, on average, come in the first week of October, regardless of the pattern.
Those tendencies seem to suggest corn and soybean prices walk hand in hand, and they do, to an extent, accounting for around half the rallies in each. Other factors feed into the equation, though not as much as might seem warranted. Exports, for example, don’t account for much of either crop’s summer rallies. Tight supplies matter more for corn than soybeans, but a key popular metric for corn — timely planting — is a nonfactor, for the most part.
But the big drivers of rallies are yields, which more often than not come down to weather. And in 2026, the top weather story is likely the cycle of El Niño warming and La Niña cooling in the equatorial Pacific.
After a shift from La Niña over the winter, neutral conditions could prevail until late spring and early summer, when El Niño returns. La Niña tends to be bad for both corn and soybean yields, while a neutral ENSO reading from June through August helps corn prospects. El Niño brings drier conditions west of the Mississippi River in June, July and August, a pattern that already emerged over the winter.
Whatever the El Niño pattern for 2026, history suggests the law of averages may be on the side of traders betting on a bull market. Yields haven’t varied much more than 5% either higher or lower than expected for a decade or more. Summer rallies still were noted, though they paled by comparison to those in the first part of the century.
Soybean moves had more juice recently than corn, as traders debated impacts from tariffs and shifting news out of China. Corn lacked that dynamic and rallies responded accordingly. No news may be good news for some, but markets often feed off headlines, and they were starved for controversies about corn.