Don't mistake the starting line for the finish line. Every May, the USDA releases its first official supply and demand report for new-crop corn — and every year, farmers who treat those numbers as fixed truth get caught off guard. Ending stocks and average farm price can both shift dramatically between planting time and the final tally.
The question isn't whether the numbers will change. It's whether you're positioned for it when they do.
Data gaps open up
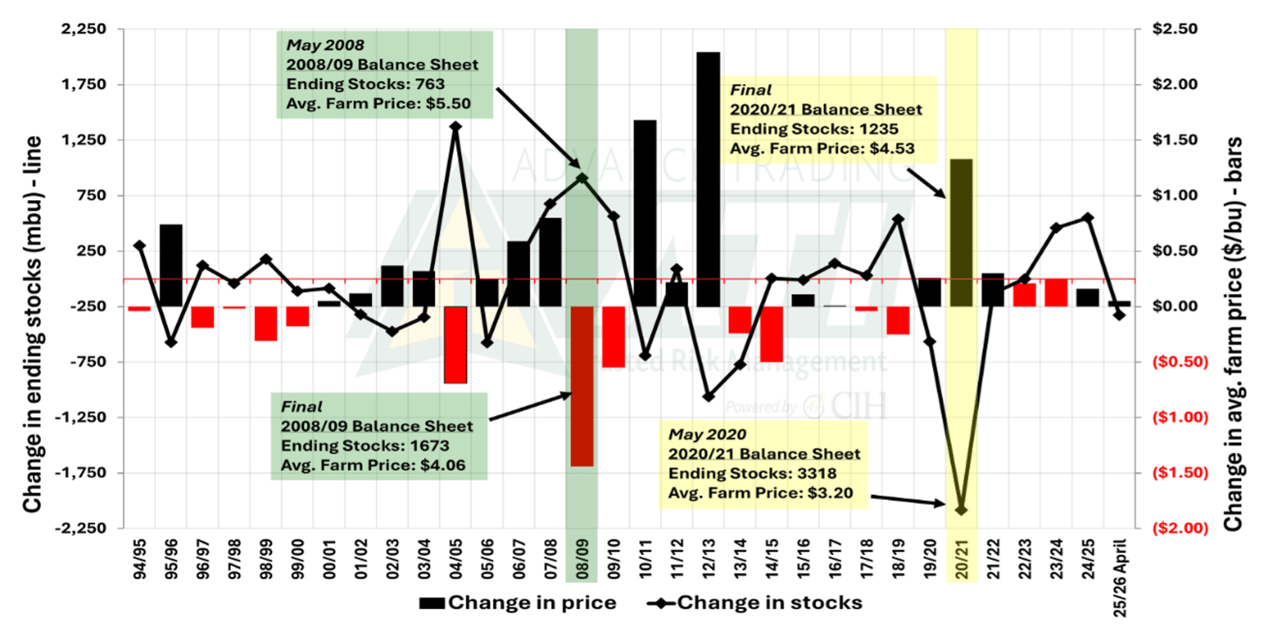
The chart below tracks how May's preliminary forecasts have diverged from final results over the years. The swings are significant.
Six years ago, USDA projected 2020-21 ending stocks at 3.318 billion bushels and an average farm price of $3.20. Lower acreage and reduced yields cut total supply by nearly 2.1 billion bushels. Final ending stocks came in at 1.235 billion — and the average farm price finished $1.33 higher than forecast.
The opposite happened in 2008-09. Demand collapsed across export, feed and industrial channels, with final usage falling 704 million bushels below the May estimate. Ending stocks finished 910 million bushels above forecast, and the average farm price dropped $1.44.
This tells us May is a framework, not a final answer.
2026-27 planting update
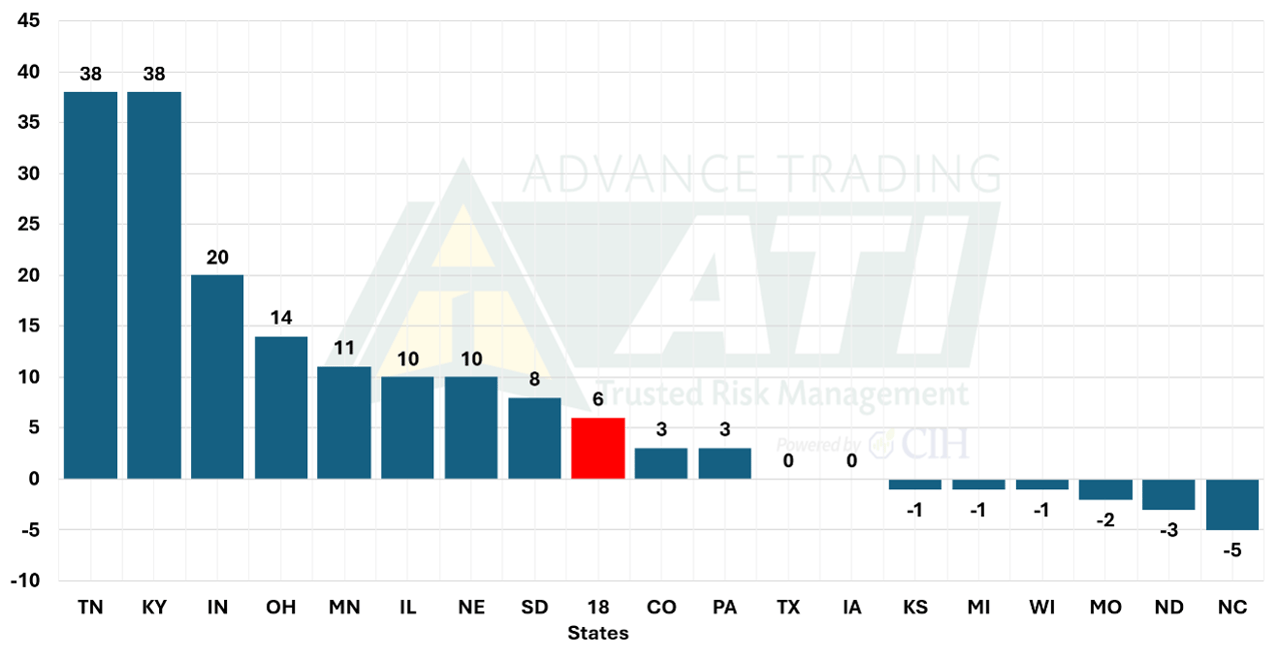
Planting is off to a solid start — 25% complete nationally, with several states running ahead of the five-year average (see chart below). A round of 1- to 2-inch rains slowed progress across the Midwest last week, but the broader mid-May forecast favors cool, dry conditions that should keep planters rolling. Watch for follow-up moisture in the next week or two. Without more rain, soil crusting could compromise germination. The Delta and Southeast, both notably dry, also saw rain over the weekend.
The 2025-26 demand picture
Foreign demand is the standout story on the 2025-26 balance sheet. Corn shipments remained strong this week, with total commitments nearly 670 million bushels ahead of last year and at 90% of the full-year USDA forecast — versus the 10-year average pace of 86%.
That said, Argentine and Brazilian supplies continue to pressure the U.S. export outlook. Private Argentine estimates have moved to 60–67 million metric tons, well above USDA's 52 MMT. Brazil's crop estimates are similarly wide at 132–144 MMT, though the southern winter crop — planted later and exposed to heat and dryness during pollination — warrants close monitoring. Brazil is also expected to raise its ethanol blend mandate from E30 to E32 for 180 days beginning in June, which could generate demand for up to 1.1 MMT of corn and partially offset its export pressure on the U.S.
On the U.S. policy front, EPA moves to raise distillate renewable fuel mandates and reallocate small refinery exemptions have pushed Renewable Identification Number, or RIN, prices sharply higher — a direct economic boost for domestic corn-based fuel production.
Even with strong exports assumed, our old-crop balance sheet runs more conservative than USDA — projecting 100 million fewer bushels in feed and residual use, 85 million fewer in ethanol grind, and 20 million more in exports. That puts our total demand estimate 165 million bushels below USDA's and our projected carryout near 2.3 billion bushels, versus USDA's 2.13 billion.
Stay flexible. Stay ready.
Markets shift. Fundamentals change. The farmers who manage risk best aren't the ones with the most certain outlook – they’re the ones with strategies that flex when the numbers change.
Advance Trading, ATI, and ATI ProMedia are DBAs of CIH Trading, LLC, a CFTC registered Introducing Broker and NFA Member. The risk of trading futures and options can be substantial. All information, publications, and material used and distributed by Advance Trading shall be construed as a solicitation. ATI does not maintain an independent research department as defined in CFTC Regulation 1.71. Information obtained from third-party sources is believed to be reliable, but its accuracy is not guaranteed by Advance Trading. Past performance is not necessarily indicative of future results.