Grain commodities saw a dramatic price sell-off in late February due to a combination of month-end position squaring by fund traders and fear selling due to tariff and trade war friction, which also led to technical selling. The grain commodity that saw one of the most dramatic selloffs was Chicago wheat futures, which lost nearly 90 cents over the past two weeks.
What’s happened
With the recent price setback, May 25 Chicago wheat futures are back at the price support area from December 24. Are the wheat fundamentals actually bearish enough to justify this recent sell-off? Or will a price rebound occur?
Wheat fundamentals are currently an equal mix of bullish and bearish, so it will be interesting to see which fundamentals gain the most traction in the coming weeks. Let’s take a closer look at current U.S. and global wheat supply and demand fundamentals.
From a marketing perspective
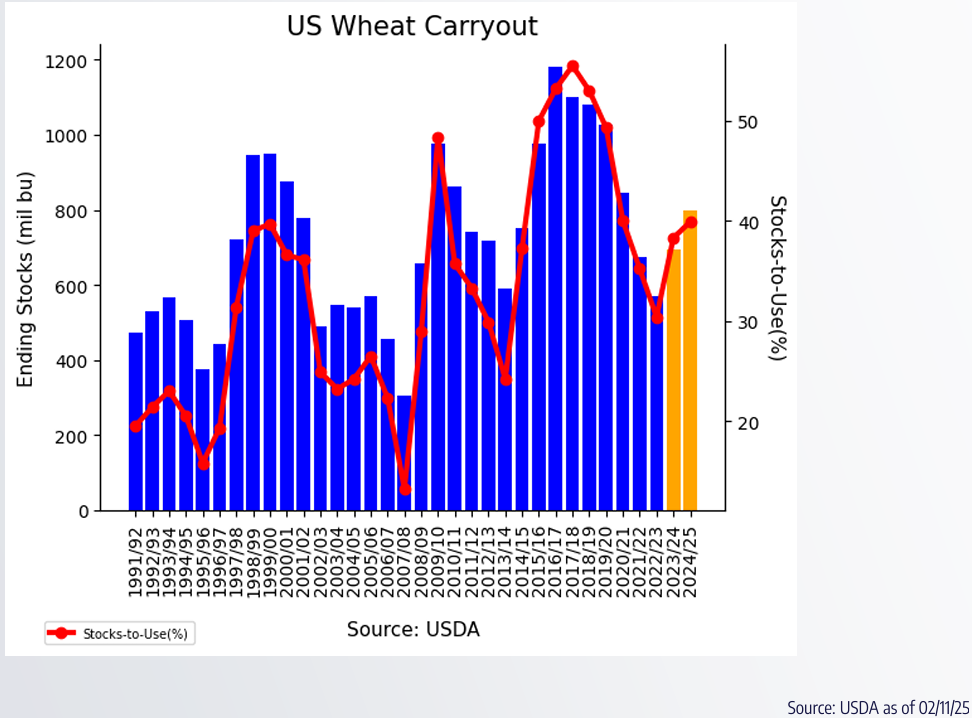
The February 2025 USDA WASDE report showed few changes from the previous month’s report. Ending stocks for all U.S. wheat is at a comfortable 794 million bushels, up from 696 million bushels last year.
Global ending stocks of wheat were pegged at 257.56 million metric tons, down from 258.82 mmt in the January USDA WASDE report.
But take note, the global ending stocks number is trending lower than previous years. The current ending stock number of 257.56 is lower than one year ago, when 2023-24 global ending stocks were pegged at 267.49 mmt. This is also substantially lower than the 2022-23 crop year when global ending stocks were at 274.27 mmt.
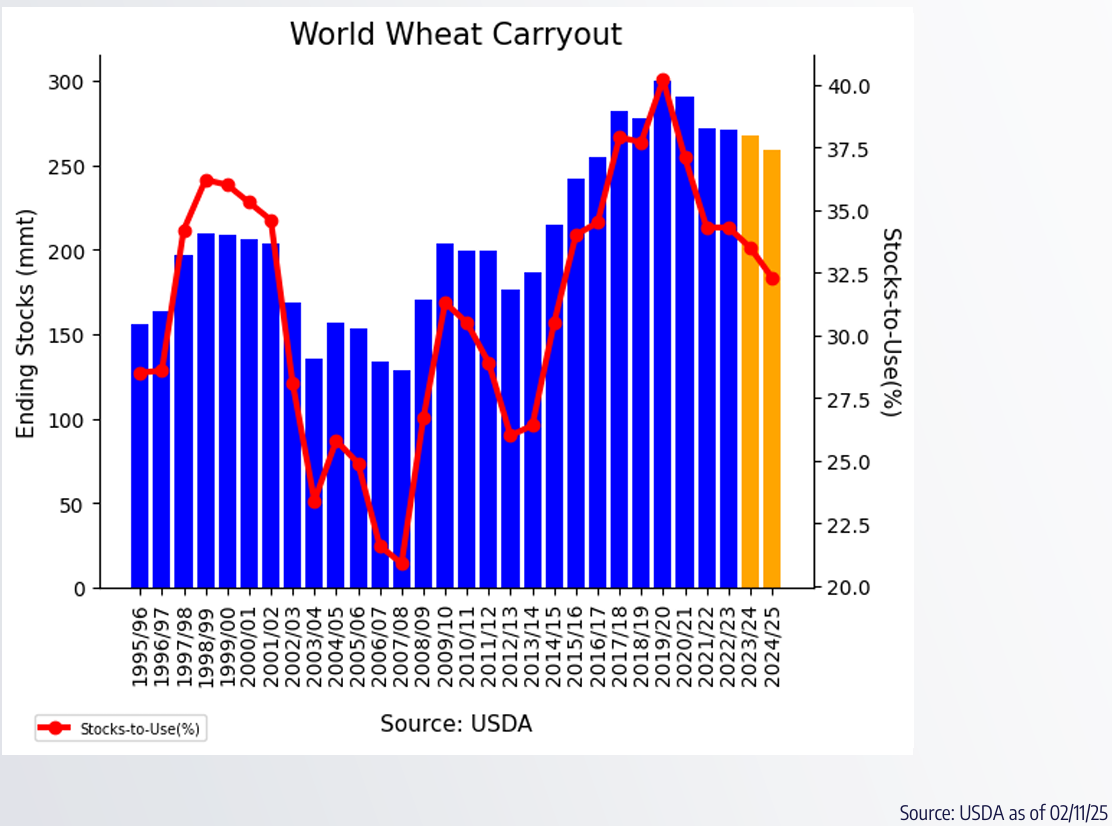
Wheat demand is strong from a global perspective, and for the past few two years, the world has not produced enough wheat to meet demand, relying instead on using global ending stock supplies. Hence the considerable draw down in global ending stocks.
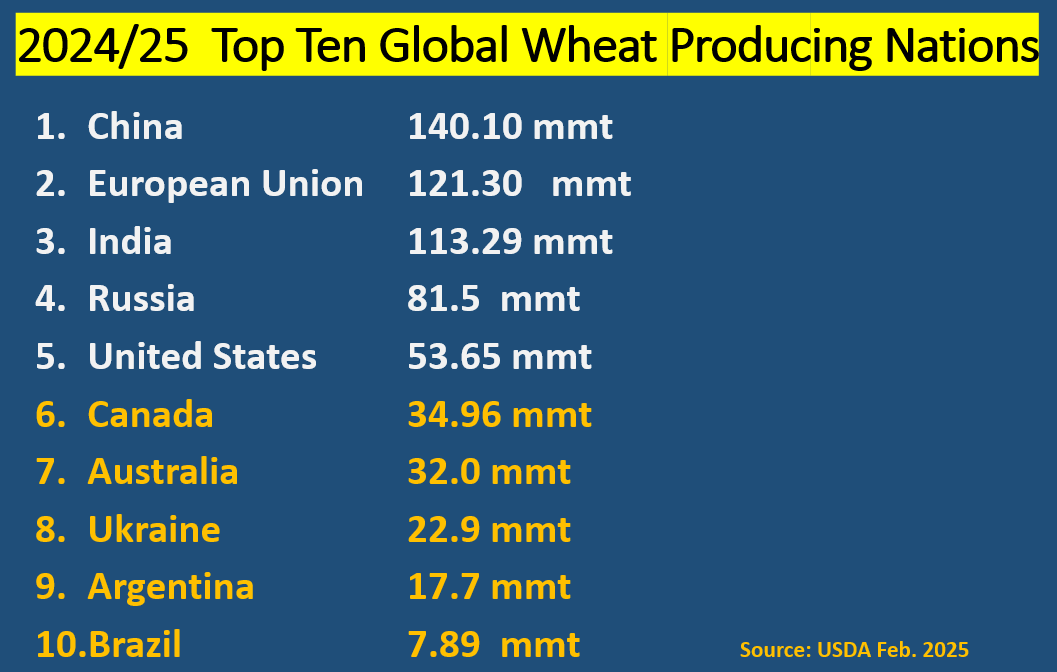
Wheat is grown all over the world in both hemispheres. Yet, when you take a look at the major wheat producing nations, the majority of wheat production occurs in the Northern Hemisphere. Here is a look at global wheat production and who the top 10 producers are.
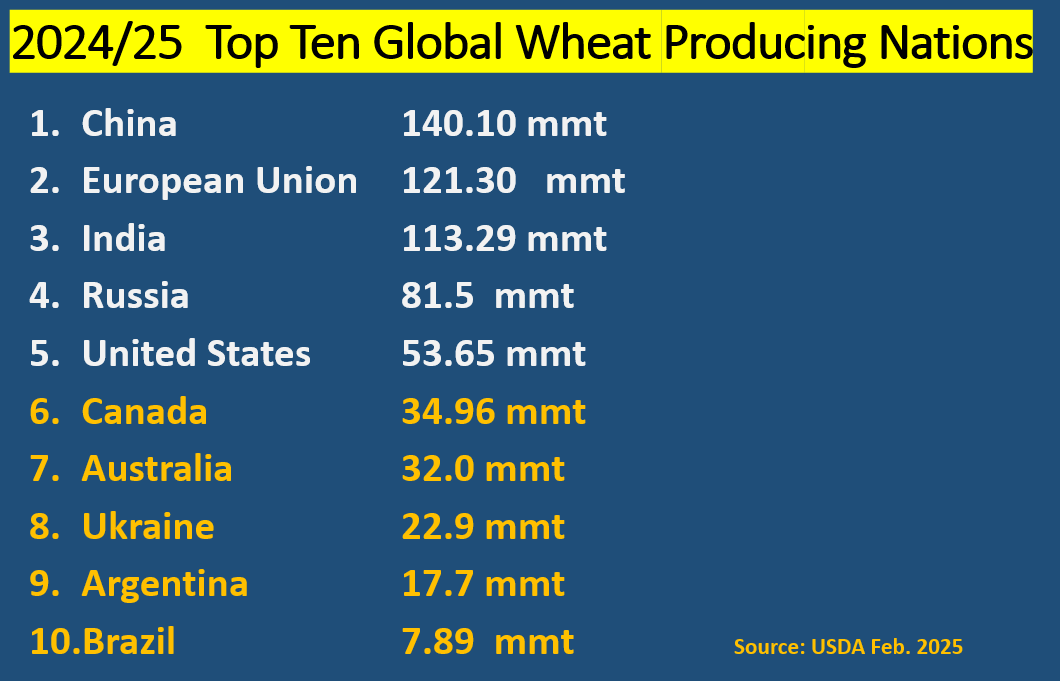
Focusing on the top three producing nations:
- China, at 140.1 mmt, is the world’s largest grower of wheat. China uses everything they grow as their total domestic demand is slated as 151 mmt, and they need to import the difference. This is where the tariff fears, and wheat futures price sell off kicked in recently. China needs to import wheat. However, due to tariffs, China may not purchase wheat from the United States.
- The European Union grows 121.3 mmt of wheat, with domestic use pegged at 109.25 mmt, allowing them to export excess.
- India is where we need to pay attention in the coming weeks. India is the world’s third largest grower of wheat at 113.29 mmt, with domestic use pegged at 112.24 mmt. They are on the verge of needing to import as their current crop may be at peril. India has been overly hot recently, with 100-degree temperatures in recent weeks. It isn’t just the heat but is also a substantial lack of rain that’s hurting the crop. India had been able to export wheat in years past. However, three years of less than stellar yields has forced India to stop exporting excess supplies and are on the verge of needing to import. If India needs to import wheat, that would be friendly to wheat prices.
- Russia, with production pegged at 81.5 mmt, is the fourth largest producer of wheat in the world. Their domestic needs are 38.25 mmt, which allows them to export a plentiful amount.
Speaking of exporting, here is a list of countries that are major global wheat exporters.
Prepare yourself
With the recent price sell-off in wheat futures, traders may quickly shift their focus to not only trade or tariff issues – which may have a lingering negative effect – but also global wheat weather for the major producing regions of the world.
With global ending stocks trending lower and strong demand, the market might be quick to respond to any adverse weather conditions.
Reach Naomi Blohm at 800-334-9779, on X: @naomiblohm, and at naomi@totalfarmmarketing.com.
Disclaimer: The data contained herein is believed to be drawn from reliable sources but cannot be guaranteed. Individuals acting on this information are responsible for their own actions. Commodity trading may not be suitable for all recipients of this report. Futures and options trading involve significant risk of loss and may not be suitable for everyone. Therefore, carefully consider whether such trading is suitable for you in light of your financial condition. Examples of seasonal price moves or extreme market conditions are not meant to imply that such moves or conditions are common occurrences or likely to occur. Futures prices have already factored in the seasonal aspects of supply and demand. No representation is being made that scenario planning, strategy or discipline will guarantee success or profits. Any decisions you may make to buy, sell or hold a futures or options position on such research are entirely your own and not in any way deemed to be endorsed by or attributed to Total Farm Marketing. Total Farm Marketing and TFM refer to Stewart-Peterson Group Inc., Stewart-Peterson Inc., and SP Risk Services LLC. Stewart-Peterson Group Inc. is registered with the Commodity Futures Trading Commission (CFTC) as an introducing broker and is a member of National Futures Association. SP Risk Services, LLC is an insurance agency and an equal opportunity provider. Stewart-Peterson Inc. is a publishing company. A customer may have relationships with all three companies. SP Risk Services LLC and Stewart-Peterson Inc. are wholly owned by Stewart-Peterson Group Inc. unless otherwise noted, services referenced are services of Stewart-Peterson Group Inc. Presented for solicitation.