After mostly neutral June 30 USDA Quarterly Stocks and Planted Acreage reports, corn futures have enjoyed a modest price rally. The question is this: How long will it last?
What’s happened
Corn futures have traded in a lackluster price pattern, mostly facing price declines due to the spring reality of higher U.S. planted corn acres.
The June 30 planted acreage report echoed that sentiment, with U.S. corn acres pegged at 95.203 million acres, up from 90.6 million acres one year ago. While the June 30 acres number was down 123,000 acres from the March Planting Intentions report, the reality is this year’s U.S. planted corn acres are the highest in 12 years.
Adding to the bearish supply tone is that for the most part the U.S corn crop is doing quite well thanks to balanced summer heat and timely rains.
The most recent USDA crop progress report suggested the U.S. corn crop is 73% good to excellent, which makes the current USDA average yield estimate of 181 bushels per acre a credible possibility. Trade chatter is that corn yield might even average higher than 181 bpa if current cooperative weather patterns persist. Some suggest yield might be closer to 183 or 184 bpa.
From a marketing perspective
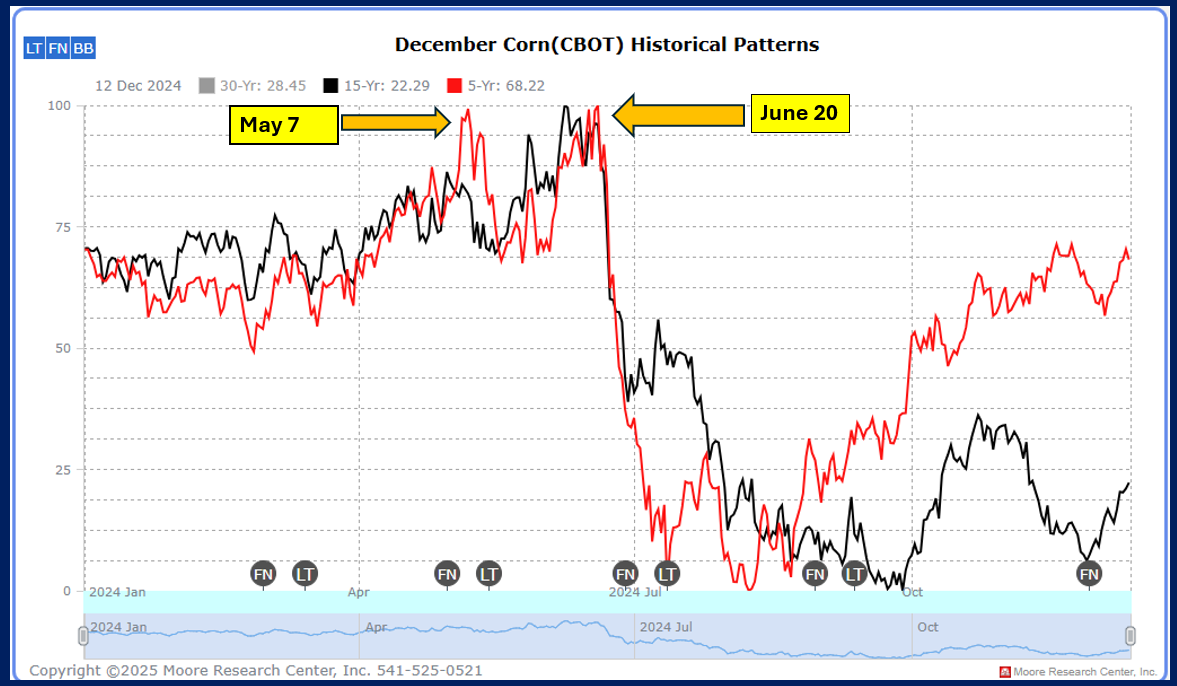
In recent years, the “summer high” price for corn has occurred primarily between the calendar window of mid-May to mid-June. Seasonals suggest that in those years December corn futures prices tend to fall lower after June 20, with a price recovery bounce around early to mid-July.
Looking back across the past 17 years, it is worthwhile to note the five years when the “summer high” occurred in July. (Note: For this research example, I used the months of May, June and July to correlate with the December seasonal pattern)
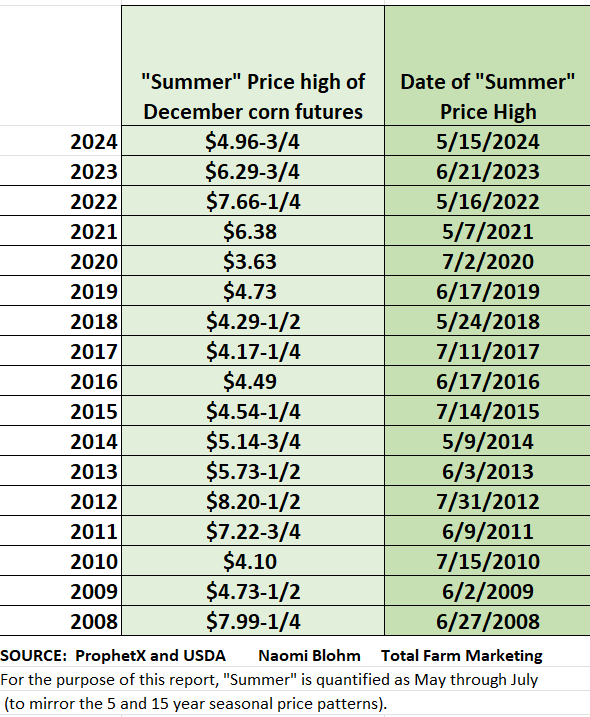
These are the years that the "summer high" occurred in July: 2020, 2017, 2015, 2012 and 2010.
Looking closer at each of those years, many fundamental and weather variables played into the price action. Though past performance is not indicative of future results, history suggests that when there is a July rally a farmer may want to use it as an opportunity to get current on cash sales, as prices in those instances show a tendency to fall lower into late July and early August.
Let’s take a closer look at each year.
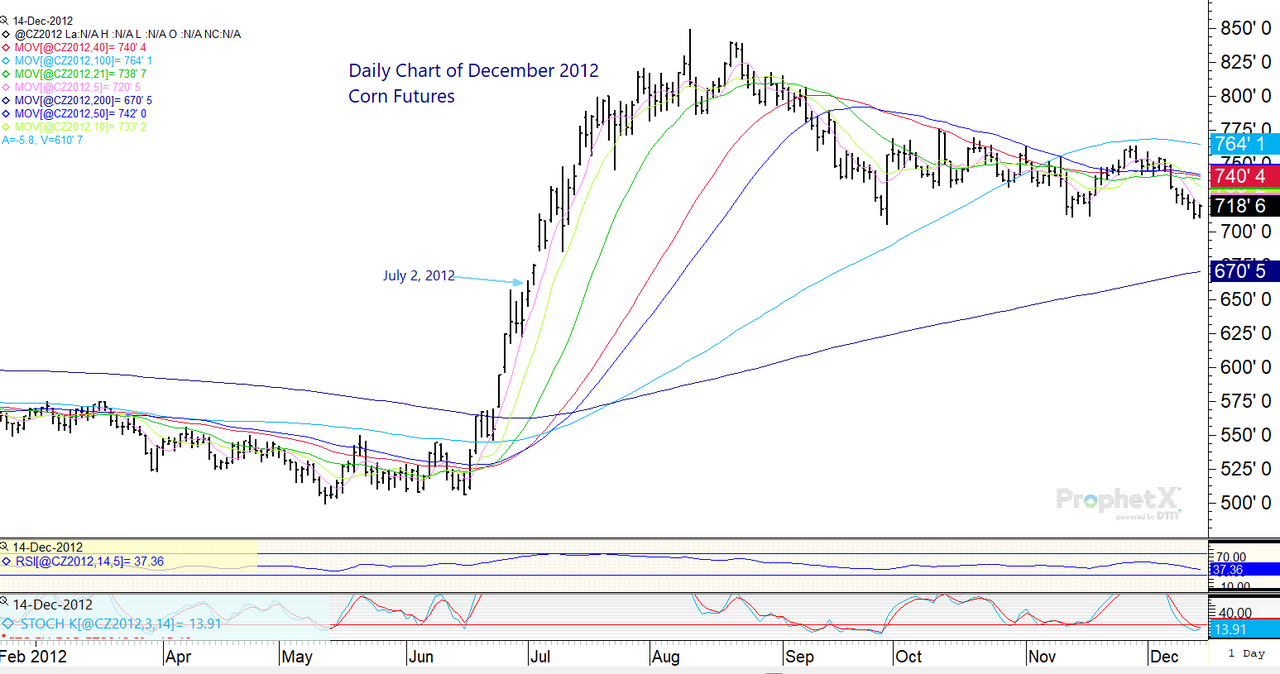
Let’s start with 2012. The drought that summer was so severe that U.S. corn production was in dire risk, which kept the corn price rallying higher, long past any traditional seasonal window. Take note, the peak for December corn futures price was actually in August that summer.
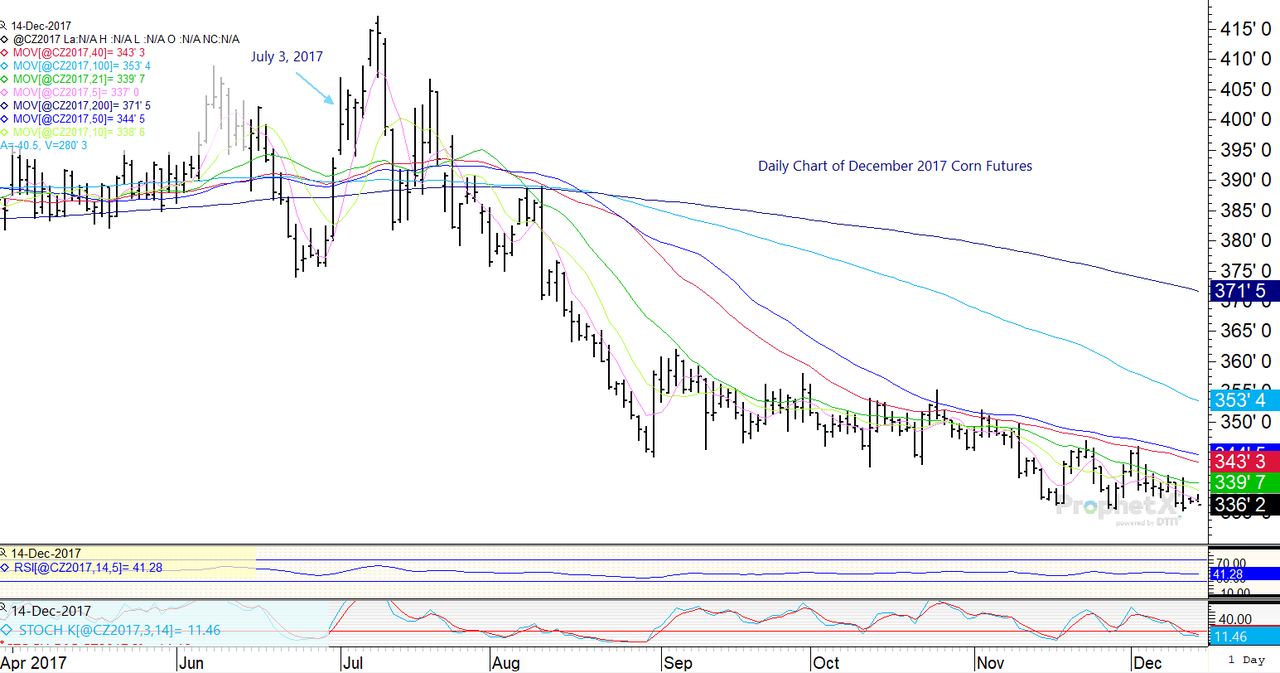
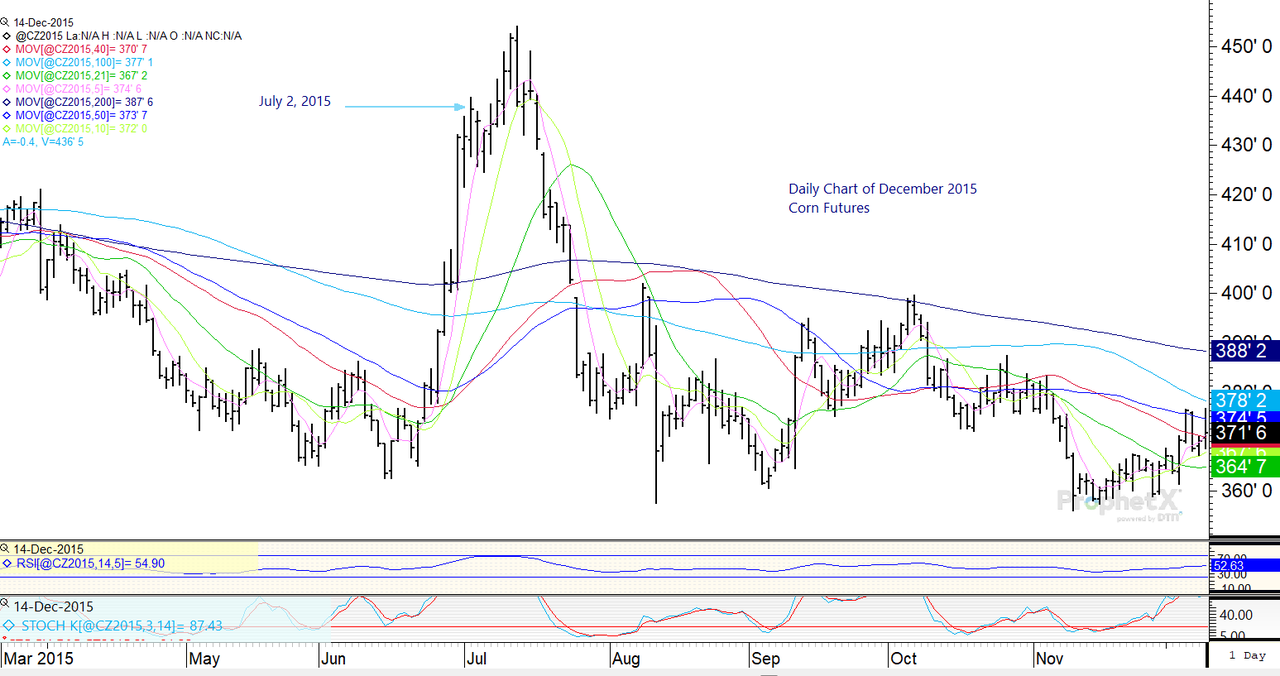
Now we’ll look at 2015 and 2017, two years where the “summer price high” occurred in July, and then prices dragged out lower well into harvest due to ample supplies.
In 2017, the “summer high” occurred in conjunction with the July WASDE.
In 2015, we saw the same scenario. The “summer high” occurred in conjunction with the July WASDE.
We will wrap up with two years where the “summer high” did occur in July, with a price reaction lower into late July or early August.
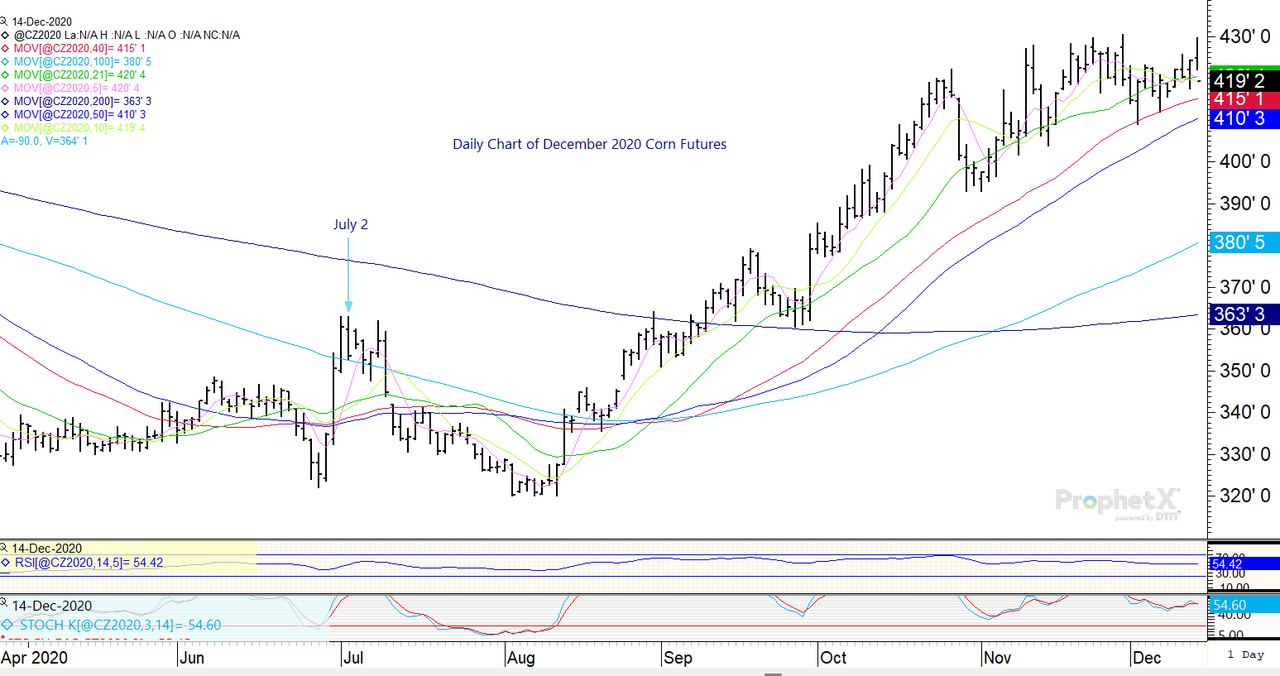
In 2010 and 2020, Mother Nature had some tricks up her sleeve, which allowed the “harvest low” to occur early, with a dramatic post-harvest rally into year end.
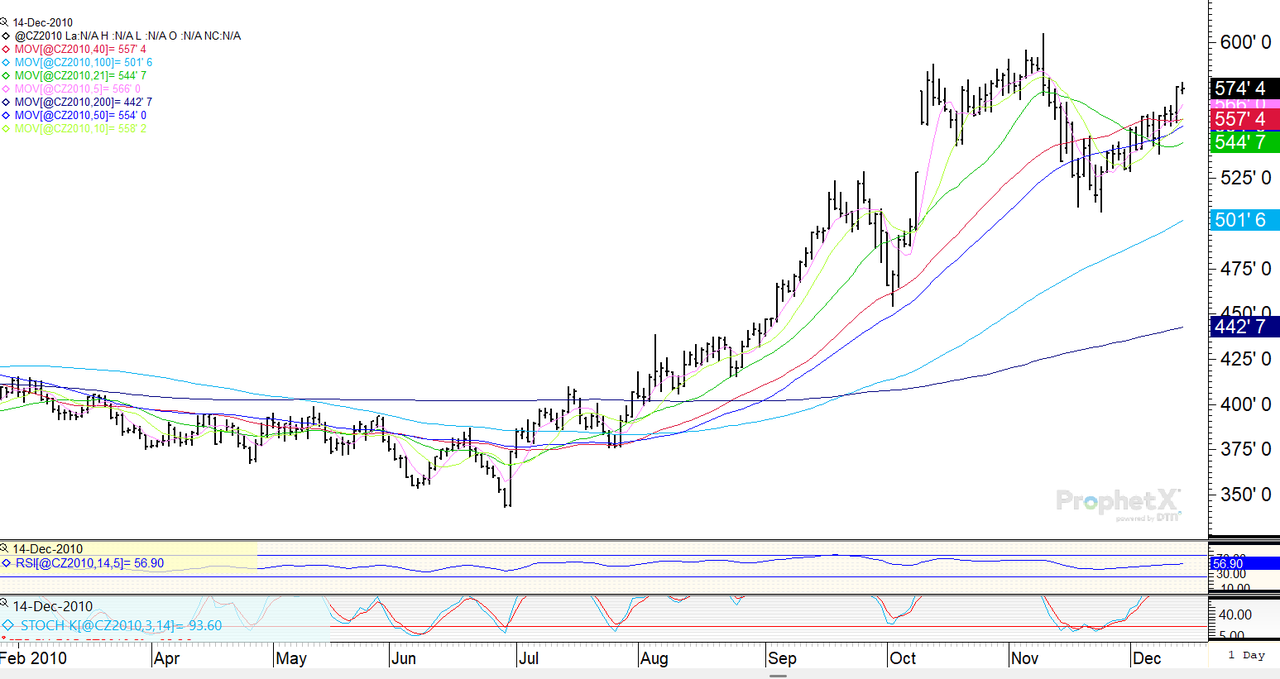
In 2010, the “summer high” occurred in conjunction with the July WASDE, and prices fell lower into late July. But prices started to inch higher during August due to weather concerns and the price rally continued well into fall.
Crop ratings in 2010 inched lower as summer progressed and yield dropped. I looked back to the monthly WASDE reports from 2010. On the June 2010 WASDE report, corn yield was pegged at 163.5 bpa. The August report suggested yield had improved, with USDA suggesting 165 bpa. However, by the November WASDE report that year, the sentiment had shifted drastically, with a large yield cut down to 154.3 bpa.
In 2020, the "summer high" occurred around the July 4 holiday weekend, and prices fell lower after that. But that year was significant as the "harvest low" was a few weeks early (in mid-August) due to the derecho storm that blasted across Iowa. And shortly thereafter, China aggressively began to purchase U.S. agricultural products to adhere to the Phase 1 trade deal.
Prepare yourself
Do we know for sure when the summer price high will occur? The reality is no. I was admittedly hopeful for a summer price high during the traditional time frame of May or June. That did not occur. Now the market may be providing a potential second chance for a July summer rally, or it might be a modest price bump.
Ultimately, Mother Nature is in charge. A hot and dry forecast, or one nasty derecho storm, could dramatically change the current fundamental landscape of the corn market.
The reality is that you need to be ready for anything. But it is helpful to be aware of historical perspectives that could offer potential clues about potential price rallies- or price pit falls.
Reach Naomi Blohm at 800-334-9779, on X: @naomiblohm, and at naomi@totalfarmmarketing.com.Disclaimer: The data contained herein is believed to be drawn from reliable sources but cannot be guaranteed. Individuals acting on this information are responsible for their own actions. Commodity trading may not be suitable for all recipients of this report. Futures and options trading involve significant risk of loss and may not be suitable for everyone. Therefore, carefully consider whether such trading is suitable for you in light of your financial condition. Examples of seasonal price moves or extreme market conditions are not meant to imply that such moves or conditions are common occurrences or likely to occur. Futures prices have already factored in the seasonal aspects of supply and demand. No representation is being made that scenario planning, strategy or discipline will guarantee success or profits. Any decisions you may make to buy, sell or hold a futures or options position on such research are entirely your own and not in any way deemed to be endorsed by or attributed to Total Farm Marketing. Total Farm Marketing and TFM refer to Stewart-Peterson Group Inc., Stewart-Peterson Inc., and SP Risk Services LLC. Stewart-Peterson Group Inc. is registered with the Commodity Futures Trading Commission (CFTC) as an introducing broker and is a member of National Futures Association. SP Risk Services, LLC is an insurance agency and an equal opportunity provider. Stewart-Peterson Inc. is a publishing company. A customer may have relationships with all three companies. SP Risk Services LLC and Stewart-Peterson Inc. are wholly owned by Stewart-Peterson Group Inc. unless otherwise noted, services referenced are services of Stewart-Peterson Group Inc. Presented for solicitation.