It’s “The Time of the Season” for corn and soybeans. The British rock band The Zombies were singing about love some 60 years ago on the AM radio of my misspent youth. But their anthem applies just as well to the grain market as weather traditionally takes center stage after the Independence Day break.
With forecasts peering into the pollination window for corn, late planting in the eastern Midwest is also an issue for both first and double-crop soybeans. But a deep freeze in the dollar helped futures rebound sharply ahead of the holiday, though some traders tried to talk up the temperature as a trigger for the rally, too.
Decisions on tariffs due July 9 are the next storm on the horizon, followed quickly on July 11 by World Agricultural Supply and Demand Estimates. Here’s what could, should and won’t change.
USDA yields hold steady
History suggests the government will be reluctant to modify 2025 crop yield forecasts—181 bushels per acre corn and 52.7 bpa soybeans—from the June WASDE ahead of August surveys of farmers and their fields.
Production estimates should still get a few tweaks, nonetheless, based on data from June 30 reports. Harvested 2025 corn acres could be down 625,000, for one. The acreage report also showed soybean seedings down 165,000 acres from March intentions, though 11.5 million acres were yet to be put in.
The new acreage estimates could chop 114 million bushels off 2025 crop corn production, with soybeans 7 million bushels lower.
The total supplies available include production and imports, as well as inventories left over from the previous year. Those old crop ending stocks could also shift.
That could take another 65 million bushels off total soybean supplies, depending on the agency’s forecast for residual usage, which would tip a smaller 2024 crop when those estimates are updated at the end of September.
Total corn supplies for 2025 could be lowered by 85 million bushels more if old crop carryout is cut because exports fall more than food, seed and industrial rises.
Traders juggle production
Even if USDA stays mum on 2025 yield projections, traders are already plugging their own numbers into forecasting models—with widely varying results.
Weekly condition ratings show 73% of corn fields rated Good or Excellent, 10% above average, pointing to record yields of 185 bpa or better. Soybean ratings are also beating normal, which could increase average yield to 53.4 bpa.
The margin of error for both crops is significant, suggesting plenty of potential for a bullish surprise eventually.
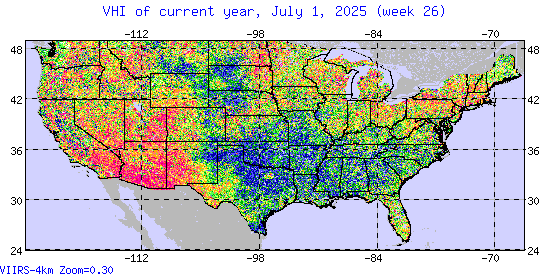
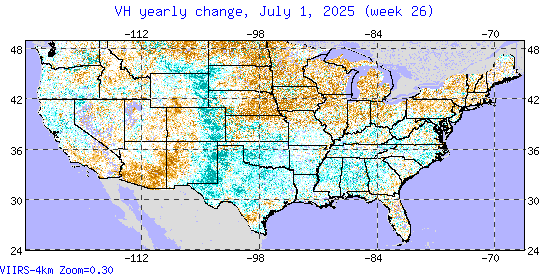
Satellite maps reflect that uncertainty. Stress is apparent in the upper and eastern Midwest and deterioration at the end of June was noticeable. The Vegetation Health Index based on these maps puts pegs soybean yields at 52 bpa with corn just 177 bpa.
Trade and tax deals
Demand forecasts for 2025 crops could also get a makeover.
As buyers and sellers alike sift through the “Big Beautiful Bill,” details about the preliminary deal with China negotiated by the Trump administration were slow to emerge. This uncertainty increases potential for the WASDE to make no changes to exports expected for the 2025-26 marketing year.
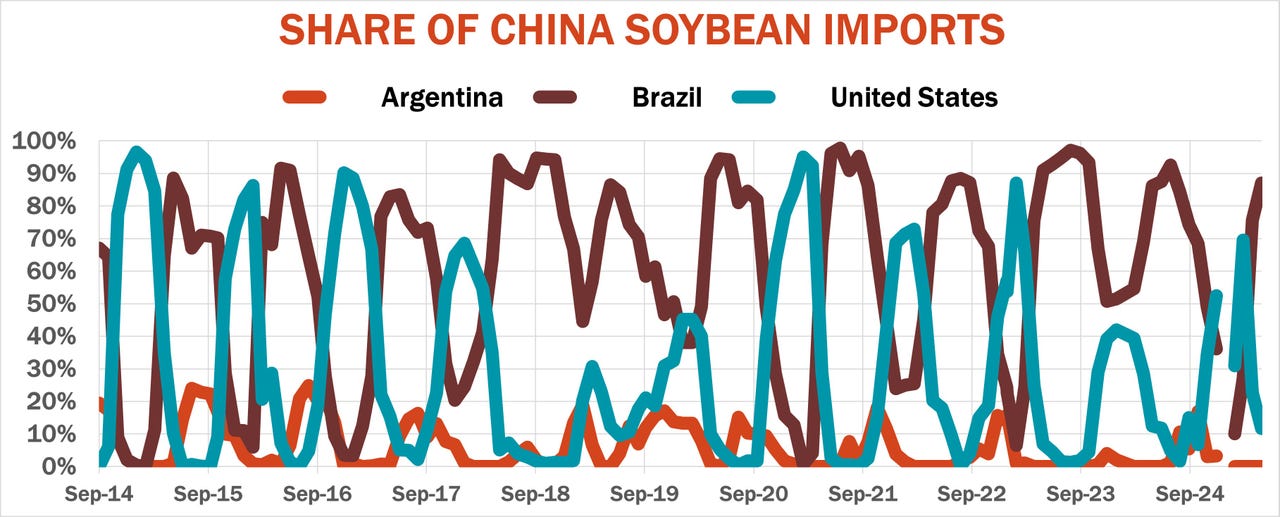
Chinese customs data shows buyers there may have front-loaded soybean imports, with 2024-25 marketing year purchases from all customers up 8% year-on-year. Brazil, as usual in May, dominated the list of sellers with an 87% market share for the month. Still, despite all the friction, the Chinese data showed exports out of the U.S. are up 38% through May, while Brazil’s deals dropped 10%. That raises hope that U.S. new crop soybean sales could hold up.
Economics and politics also complicate forecasts of U.S. domestic demand, especially for corn.
- A bigger U.S. crop should be positive for usage, but projected 2025-26 ending stocks could still be up 50 million bushels or so. That’s not enough to tank the market, but it could knock a nickel or so off average cash prices received by farmers, which are already projected below the cost of production.
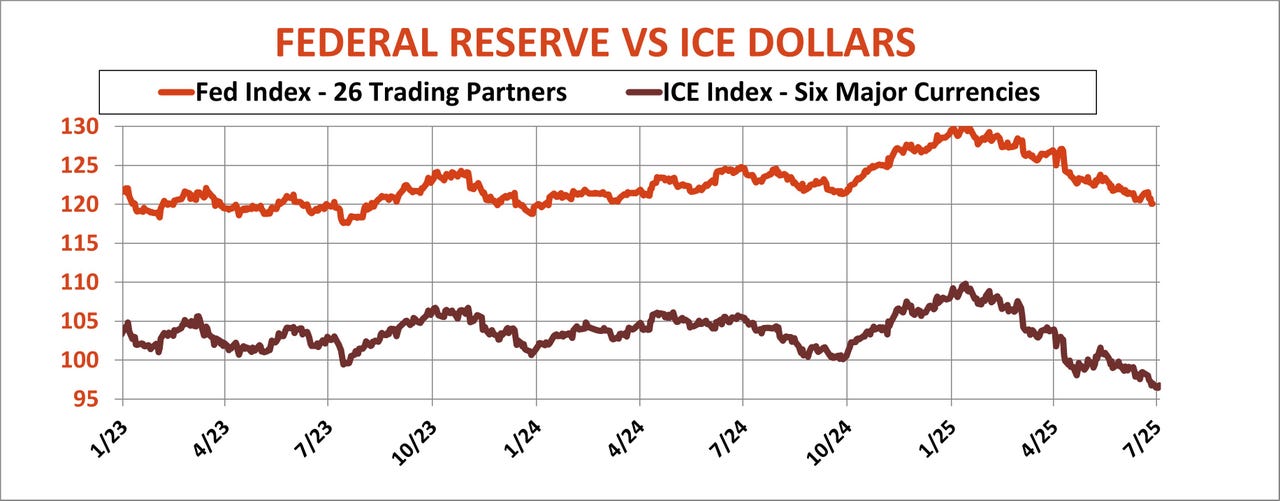
- A wild card to watch is the dollar, which broke to fresh lows that were 12% off 2025 highs—and that tends to be positive for commodity prices denominated in greenbacks. The dollar index of six widely traded currencies is down more than the broader gauge that includes more trading partners. Some of the weakness may have been caused by fears the dollar is losing some of its safe haven status due to questions about U.S. stability. That could trigger volatility on Wall Street that spills over to Chicago futures.
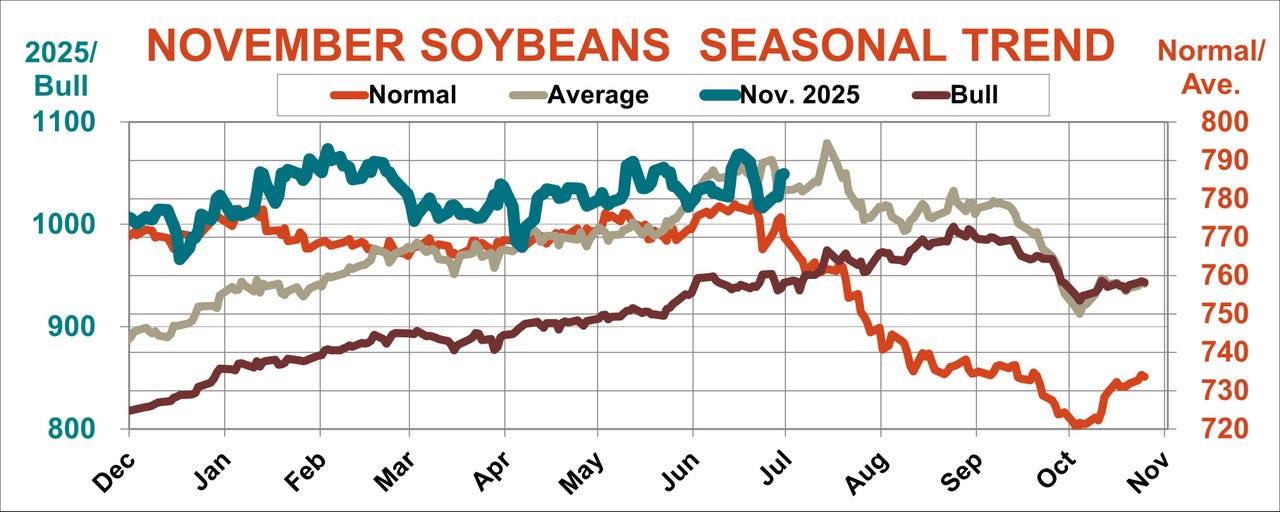
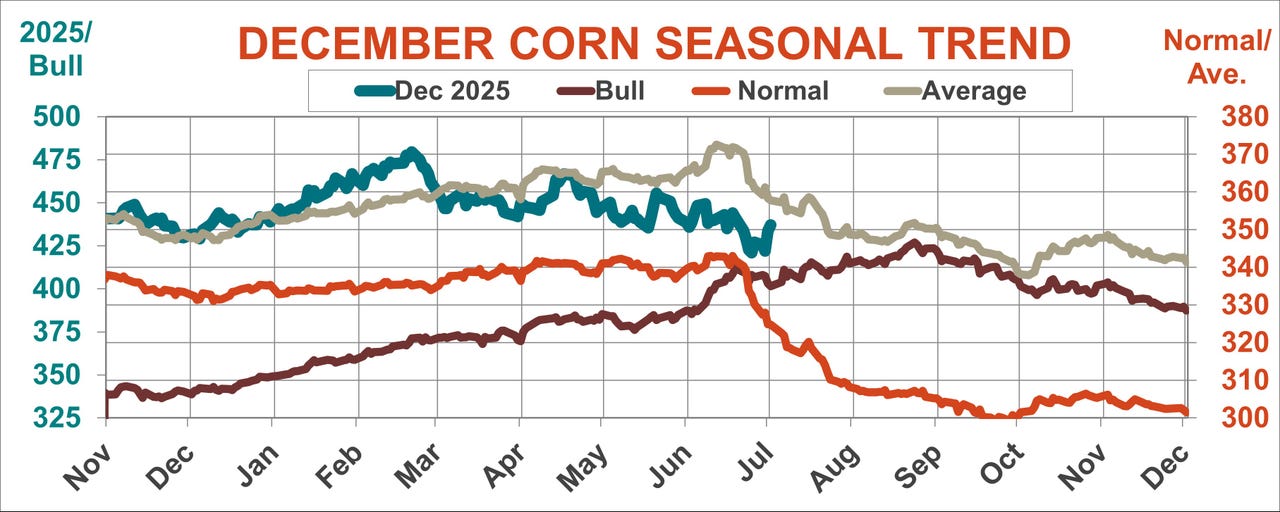
Seasonal trends for both corn and soybeans suggest markets are at turning points when trading for July heats up. In years of normal production, both markets tend to keep falling until harvest, an ominous sign for growers without price protection.