Cotton futures, like many commodities, enjoyed a triumphant price rally in 2021 and into 2022. However, cotton futures prices are now back down to modest price levels not seen since 2020. The fundamental story for cotton has been rather monotonous recently, and thus, cotton futures have traded in a lackluster trading pattern.
What’s happened
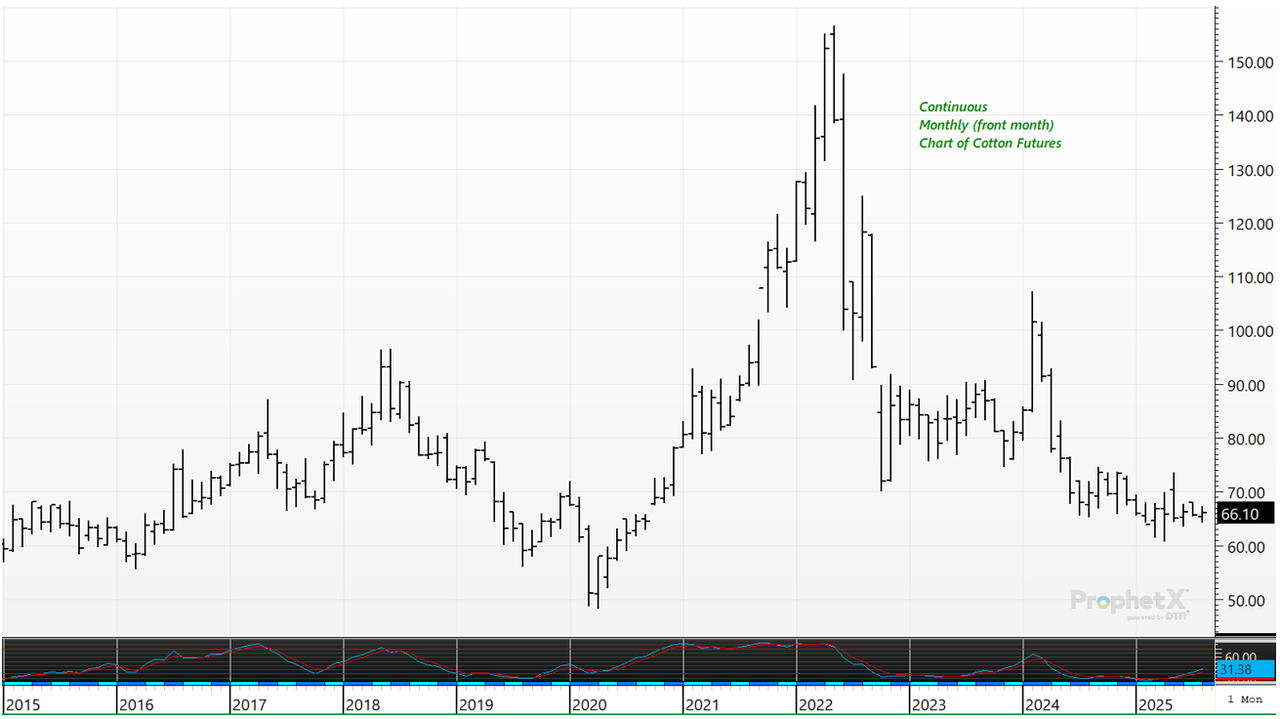
Back in late May of 2022 front month cotton futures prices topped out at a whopping 156.64 cents per pound with prices falling over the past three years to near 67 cents per pound, as of this writing.

With a lack of dynamic news in the cotton market, cotton futures prices have been in a sideways trading range for nearly three months.
However, the August USDA WASDE report provided a bit of unexpected friendly news that perked the market higher thanks to a surprise reduction in U.S. cotton production.
From a marketing perspective
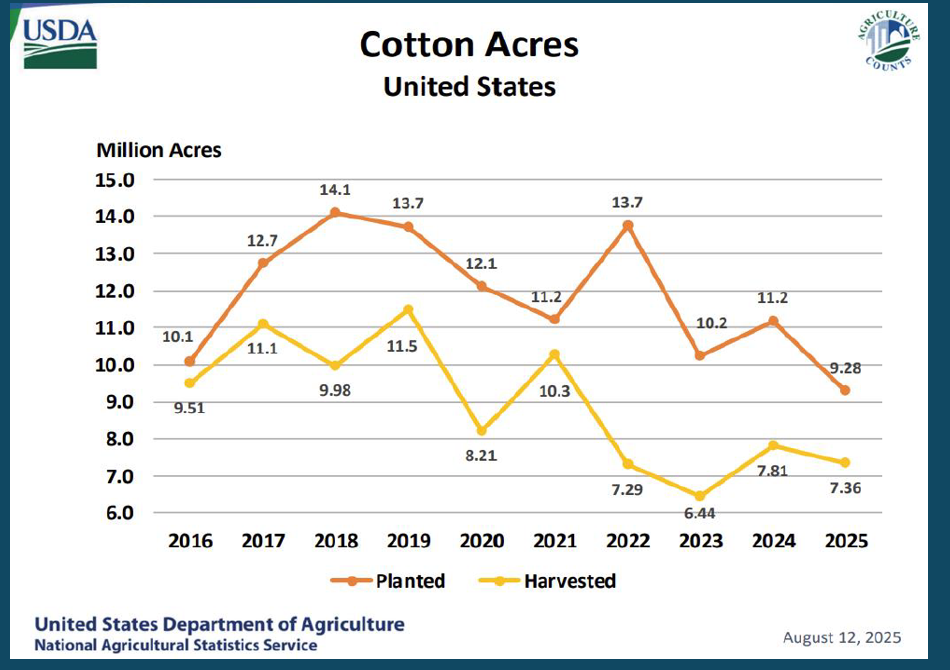
In the August report, the USDA pegged cotton production lower, due to a sharp revision lower in planted area.
The USDA lowered United States planted cotton acres to 9.28 million acres, which was down from the July report, at 10.12 million acres. The abandonment rate for acres increased to 20.7%, up from 14.4%, due to dryness in the Southwest. That puts harvested area at 7.36 million acres.

While USDA lowered planted acres, it increased yield to 862 pounds per acre, up from 809 pounds in July.
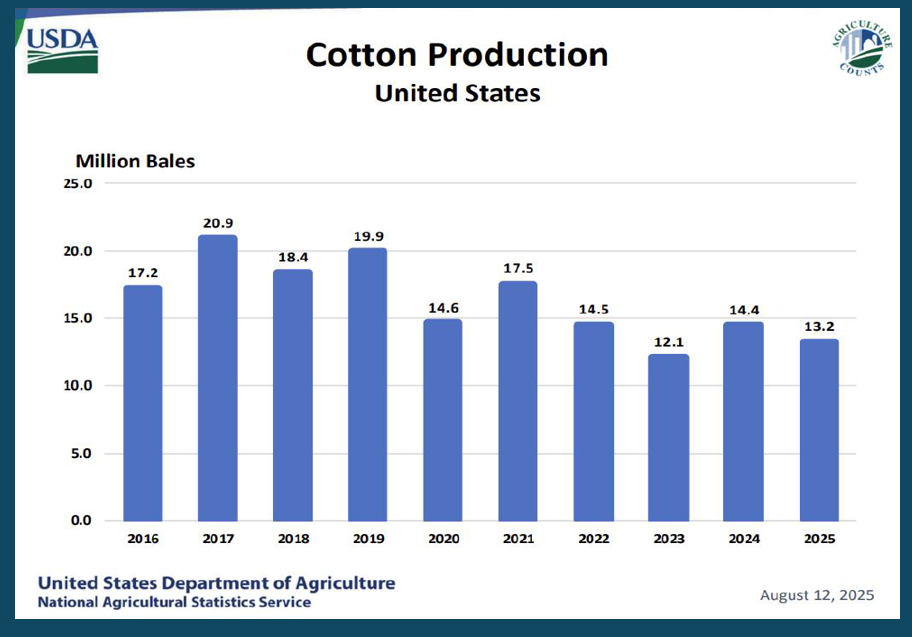
The combination of lower acres and higher yield put U.S. 2025-26 cotton production at 13.21 million bales, down from 14.60 million in the July update.

Though the supply situation turned friendly for cotton, the demand situation remains murky. And low demand is what’s keeping price action in check.
Looking closer at demand, USDA lowered cotton exports for the 2025-26 season to 12 million bales, down from 12.50 million previously as the United States continues to lose export demand to China.
The ending result when looking at both supply and demand, is that U.S. ending stocks for cotton came in at 3.60 million bales versus 4.60 million in July. This is also below the ending stock number of 4 million from the 2024-25 crop year. This news is likely supportive to cotton prices, but not enough of a reason at the moment, to justify a significant further price rally.
Prepare yourself
Lower production in the August WASDE gave the market a short-term price lift, but global supplies are viewed as ample, which may keep rallies in check.
- Global 2025-26 production is marked at 116.622 million bales.
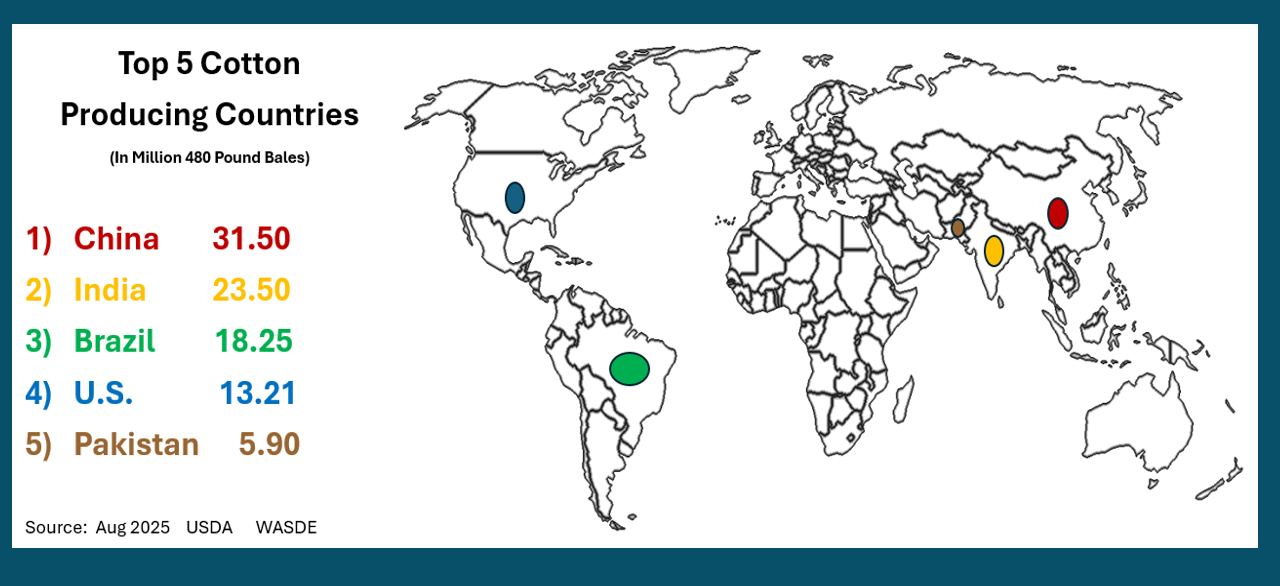
- China is the world’s largest grower of cotton. The August WASDE report increased China’s production by 0.5 million bales to 31.5 million bales.
- India is the second largest for cotton production, coming in at 23.5 million bales.
- Brazil is ranked third, with production pegged at 18.25.
- The United States comes in at fourth place, with 13.21 million bales of production.

Global ending stocks for the 2025-26 crop year are pegged at 73.91, down from 75.05 in the 2024-25 crop year, and similar to ending stocks from the 2023-24 crop year when global ending stocks were pegged at 73.36.
Global production is viewed as good enough for now, while global consumption remains in limbo with a global economic marketplace that remains in question. Without a global shake up in production, or a sudden increase in demand, cotton prices might remain in a monotone price pattern into late 2025.
Reach Naomi Blohm: 800-334-9779 Twitter: @naomiblohm and naomi@totalfarmmarketing.com
Disclaimer: The data contained herein is believed to be drawn from reliable sources but cannot be guaranteed. Individuals acting on this information are responsible for their own actions. Commodity trading may not be suitable for all recipients of this report. Futures and options trading involve significant risk of loss and may not be suitable for everyone. Therefore, carefully consider whether such trading is suitable for you in light of your financial condition. Examples of seasonal price moves or extreme market conditions are not meant to imply that such moves or conditions are common occurrences or likely to occur. Futures prices have already factored in the seasonal aspects of supply and demand. No representation is being made that scenario planning, strategy or discipline will guarantee success or profits. Any decisions you may make to buy, sell or hold a futures or options position on such research are entirely your own and not in any way deemed to be endorsed by or attributed to Total Farm Marketing. Total Farm Marketing and TFM refer to Stewart-Peterson Group Inc., Stewart-Peterson Inc., and SP Risk Services LLC. Stewart-Peterson Group Inc. is registered with the Commodity Futures Trading Commission (CFTC) as an introducing broker and is a member of National Futures Association. SP Risk Services, LLC is an insurance agency and an equal opportunity provider. Stewart-Peterson Inc. is a publishing company. A customer may have relationships with all three companies. SP Risk Services LLC and Stewart-Peterson Inc. are wholly owned by Stewart-Peterson Group Inc. unless otherwise noted, services referenced are services of Stewart-Peterson Group Inc. Presented for solicitation