Washington is flying blind. Without official government data, officials in the government risk making decisions in a void.
In the short run this vacuum may not matter much. But a government shutdown lasting a month or more could rattle markets of all stripes. At the Federal Reserve, where numbers reign supreme, the central bank faces the next update to monetary policy at the end of its two-day meeting Oct. 28-29, potentially lacking key inputs on employment and inflation.
But the lights are still on at the nation’s exchanges, where markets send and receive their own signals – and here’s what these messages tell us about corn and soybean prices and more.
Are supplies smaller?
USDA called out one last hurrah before Congress turned out its lights. The agency on Sept. 30 published Crop Progress ratings, offering context to the World Agricultural Supply and Demand Estimates Sept. 12 and the grain stocks and summary of small grains reports released two weeks before that.
The September WASDE pointed to record yields, along with the biggest corn crop ever and fifth best soybean harvest. But do those impressive results belie what was happening under the hood? The final sample of data points from D.C. suggests supplies may not be as big as feared because late-season drought could be taking the top end off yield potential. But does supply even matter if demand for crops is weak?
Look to the VHIs and the Drought Monitor
Satellites buzzing through space maintain their orbits and keep sending back data automatically to computers that keep on processing results. Humans aren’t around to tweak the output, but Vegetation Health Indexes that don’t require “manual intervention” still are coming out. The weekly Drought Monitor website is also up and running.
These orbiting sensors don’t predict yields on their own. But it’s far from rocket science to plug this data into models that translate these correlations into statistically valid forecasts of production.
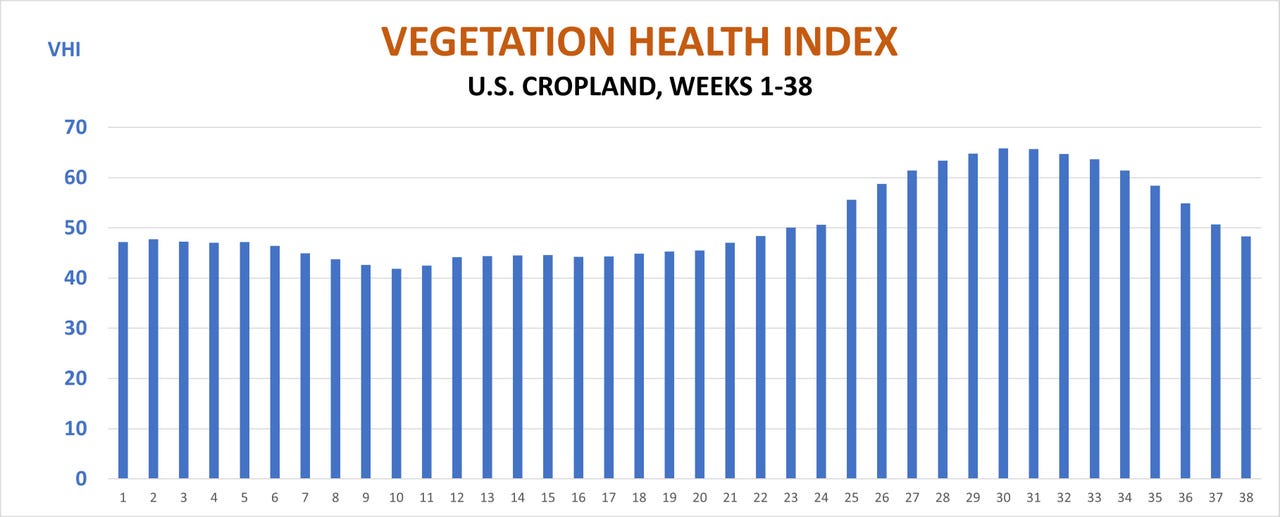
VHIs for U.S. cropland dropped nearly 5% Sept. 30, enough to dent soybean yields slightly while taking a bigger hit on corn. Projecting the VHI takes nearly 4% off the 2025 WASDE corn yield—around 625 million bushels of total production. If demand holds constant with USDA’s September forecast, average cash prices received by farmers could be significantly higher than the $3.90 the government projected, perhaps by 80 cents to $1 a bushel more.
Demand is tough to track
Demand normally varies with the size of the crop, but tracking use is more complicated without government data on exports and ethanol production. That’s where the market can provide clues from basis and carry.
A bull market on the horizon?
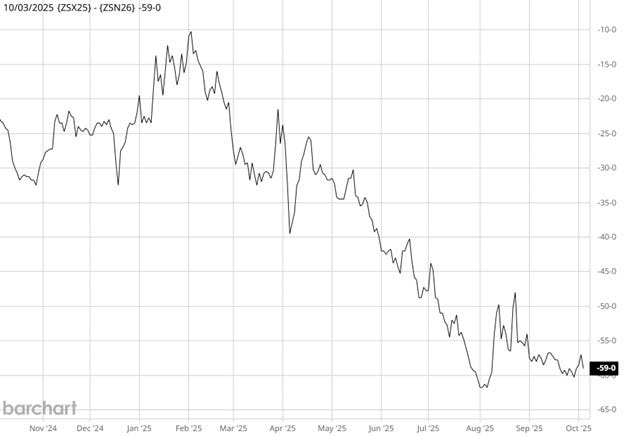
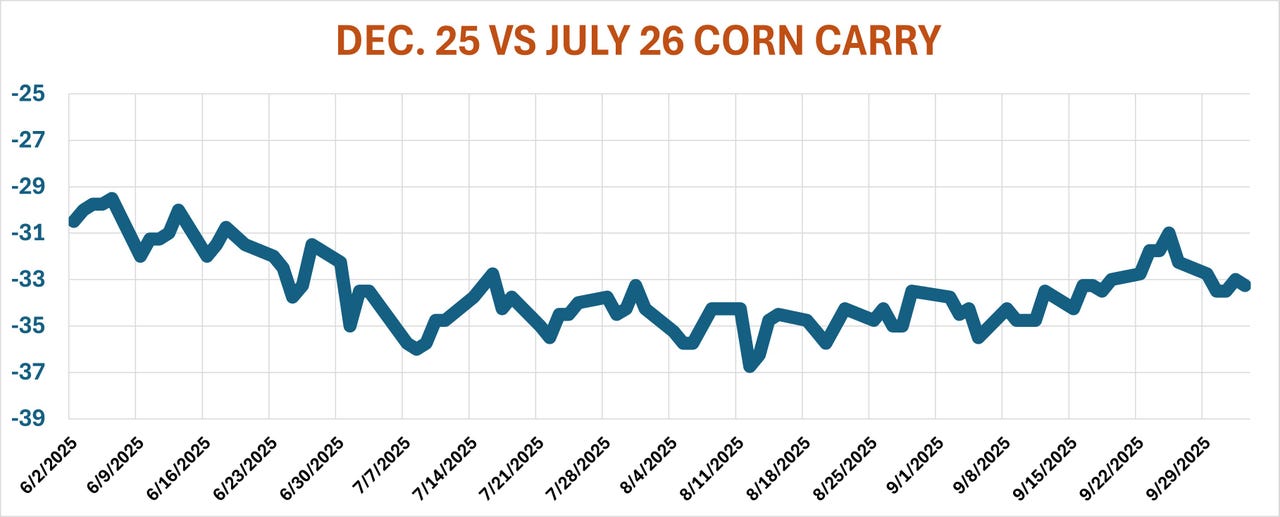
The spread between 2025 harvest delivery futures—November soybeans and December corn – and contracts for delivery later in the marketing year, can be one tip-off.
- Dec. 25 corn traded as much as 37.25 cents less than the July 26 contract on Aug. 13, the day after the WASDE dropped.
- Since then, corn carry narrowed, trading at 31 cents in the last week of September.
That much change is more than usual and could be caused by two factors:
- more buying of July could suggest new demand
- less selling in the December might reflect less hedging of corn coming in off the combine.
Either would be bullish long-term for corn.
Commitment of Traders reports might shed light on these patterns, but the CFTC is also shut down.
Spreads in the biofuel complex could fill in some of these gaps about demand. October ethanol traded to a 13-cent premium over gasoline last week, the most in four years and a hint that blending is more profitable.
Soybean crush margins, however, headed in the other direction, ending September near the weakest levels of the summer—suggesting plants have less incentive to bid up for the soybeans they purchase from farmers.