Demand for corn, soybeans and wheat in the U.S. and around the world is strong, even as global weather wreaks havoc on supply potential. Ending-stock supplies for grains began to edge lower in August, with stocks-to-use ratios suggesting a bullish story may be developing for 2027.
What’s happened
What once was a bearish price outlook for corn, soybeans and wheat just two months ago has shifted into a supportive price action situation. The drought in Europe this summer reduced the European Union wheat and corn crop, and U.S. grain production suffered due to adverse weather conditions, including drought in the western Midwest and flooding in the eastern Midwest.
The next USDA World Agricultural Supply and Demand Estimates report comes out Sept. 11. Looking ahead to that report, initially traders will look closely at each yield number released by USDA — is it higher or lower than trade expectations, and by how much? Next, traders will focus on total supply and changes to demand, and how that equates to ending stocks.
Ending stocks is a way to quickly measure how much supply is left over or expected to be left over after any crop year. The stocks-to-use percentage is a more detailed view. It shows a different way to see how strong demand is when considered against current supplies.
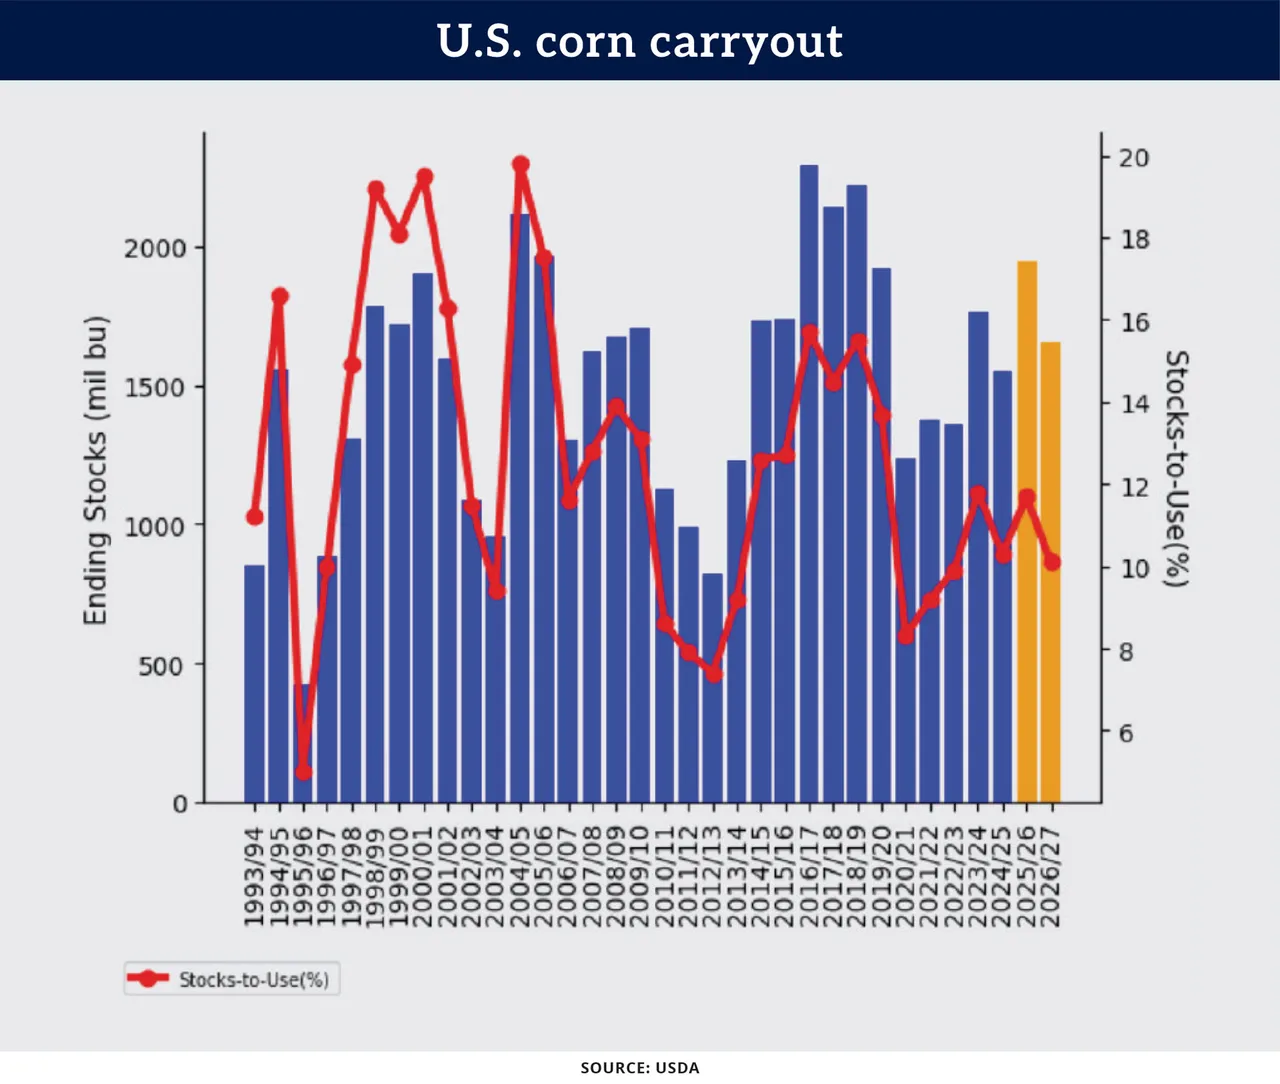
Trending lower, U.S. corn ending stocks for the 2026-27 crop year are pegged at 1.65 billion bushels, with a stocks-to-use ratio of 10.1%. This is the lowest stocks-to-use ratio in four years.
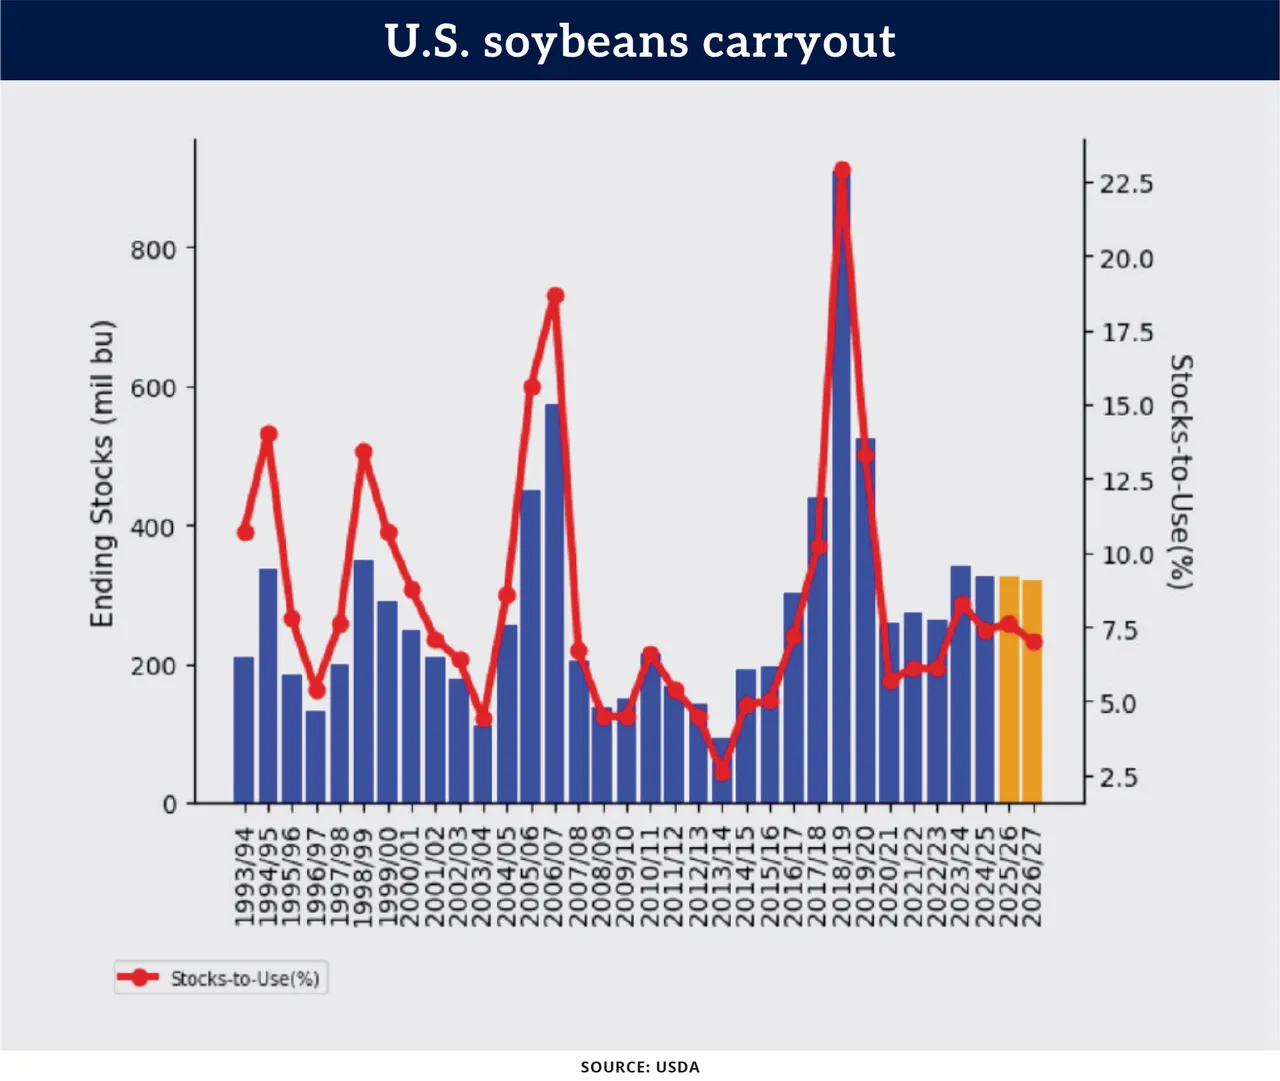
Holding at a lower number, U.S. soybean ending stocks for the 2026-27 crop year are marked at 320 million bushels, with a stocks-to-use ratio of 7%.
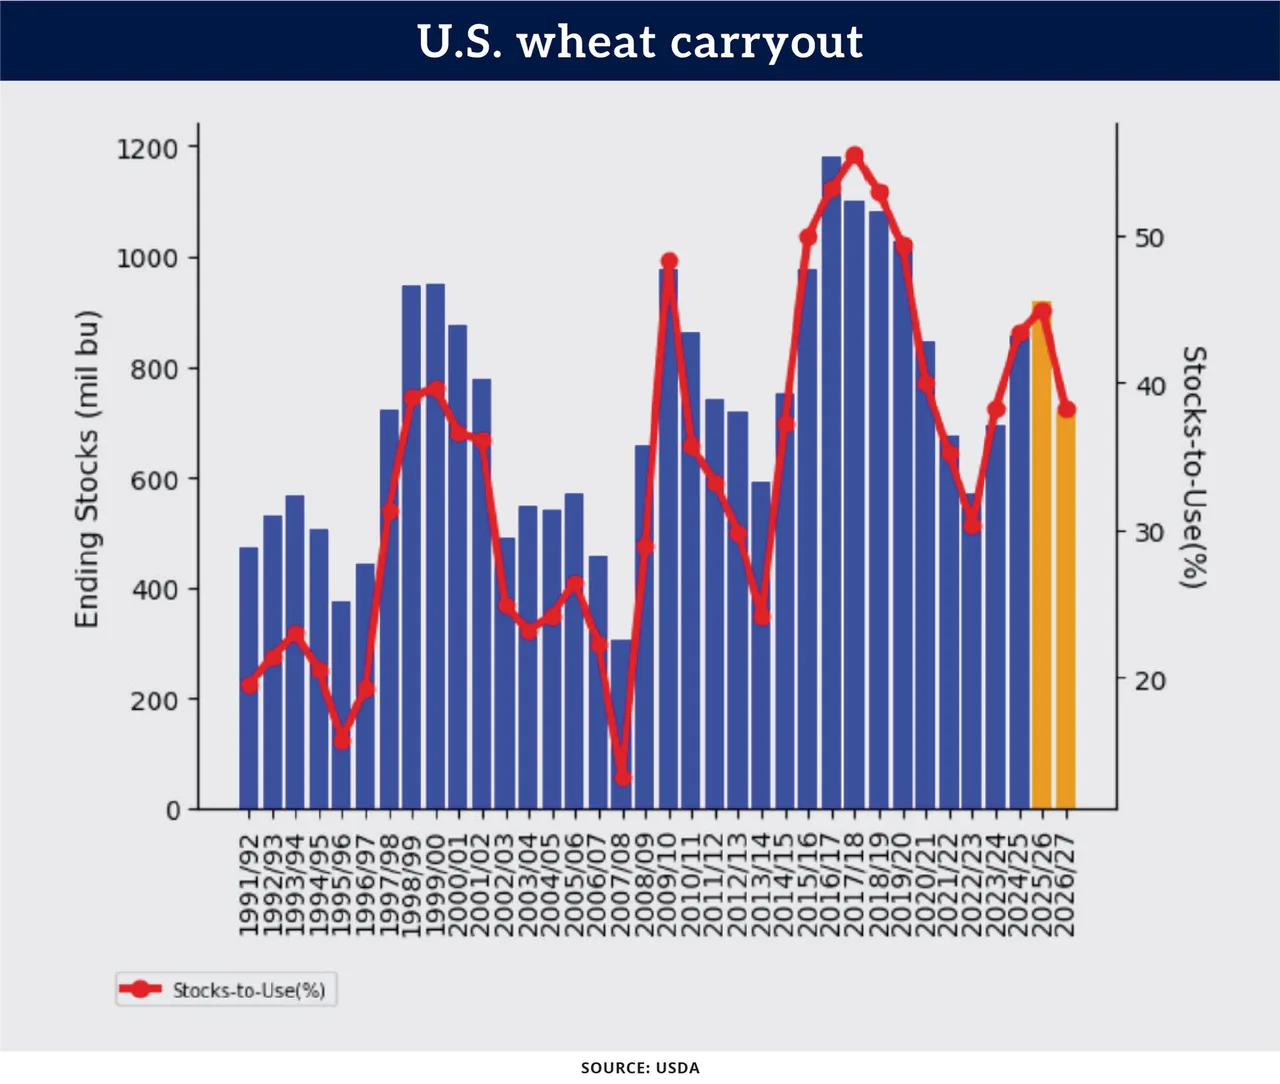
Just starting to trend lower, U.S. all-wheat ending stocks for the 2026-27 crop year are estimated to be at 717 million bushels, with a modest stocks-to-use ratio of 38.3%.
From a marketing perspective
When you compare both the ending stocks along with the stocks-to-use ratio against previous years, this percentage number is a fantastic indicator of whether current ending-stock levels are at historically small amounts (and justification for higher prices), or plentiful amounts (often an indication that prices will move lower).
To calculate the stocks-to-use ratio, take the ending stock number and divide that by the total demand usage number (provided on the USDA report), which can then be expressed as a percentage.
Currently the stocks-to-use ratio for new crop corn and soybeans is trending lower. This means USDA’s September report will be of utmost importance to know where new crop ending stocks will be, and how that correlates into stocks to use. This will set the tone for the rest of 2026.
Prepare yourself
When planning market scenarios, be aware of the possibilities that prices can work either higher or lower. Be ready to capture opportunities and minimize price risks. Having a fundamental understanding of supplies, demand, ending stocks and the stocks-to-use ratio empowers you to make better marketing decisions for the current year and beyond.
The bottom line is that due to the drought in Europe and the extreme heat in the U.S. this summer (and now flooding), U.S. and global ending stocks are trending lower. In the big picture — because demand is so strong for corn, soybeans and wheat, and because “stocks-to-use ratios” for ending stocks are trending lower — any further weather concerns around the world in the coming months would absolutely be a reason for sharply higher prices in December, January or February.
Reach Blohm at naomi@totalfarmmarketing.com or find her on X @naomiblohm.
Disclaimer: The data contained herein is believed to be drawn from reliable sources but cannot be guaranteed. Individuals acting on this information are responsible for their own actions. Commodity trading may not be suitable for all recipients of this report. Futures and options trading involve significant risk of loss and may not be suitable for everyone. Therefore, carefully consider whether such trading is suitable for you in light of your financial condition. Examples of seasonal price moves or extreme market conditions are not meant to imply that such moves or conditions are common occurrences or likely to occur. Futures prices have already factored in the seasonal aspects of supply and demand. No representation is being made that scenario planning, strategy or discipline will guarantee success or profits. Any decisions you may make to buy, sell or hold a futures or options position on such research are entirely your own and not in any way deemed to be endorsed by or attributed to Total Farm Marketing. Total Farm Marketing and TFM refer to Stewart-Peterson Group Inc., Stewart-Peterson Inc., and SP Risk Services LLC. Stewart-Peterson Group Inc. is registered with the Commodity Futures Trading Commission (CFTC) as an introducing broker and is a member of National Futures Association. SP Risk Services, LLC is an insurance agency and an equal opportunity provider. Stewart-Peterson Inc. is a publishing company. A customer may have relationships with all three companies. SP Risk Services LLC and Stewart-Peterson Inc. are wholly owned by Stewart-Peterson Group Inc. unless otherwise noted, services referenced are services of Stewart-Peterson Group Inc. Presented for solicitation.